Figure 4.
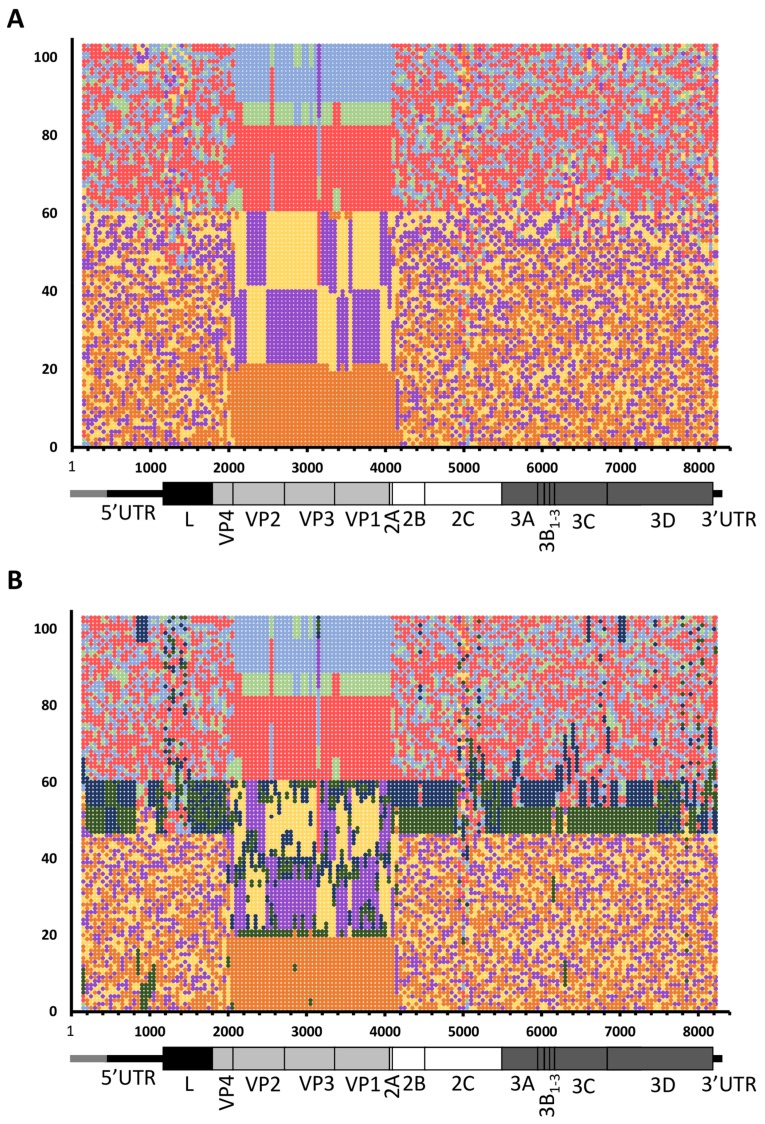
Phylogenetic Signal Scan analysis reveals the extent of distinct phylogenetic signatures of QENP and uEA FMDV lineages. (A) Whole genome MSA was subjected to TreeOrder Scan implemented in SSE v.1.3 software using a sliding window of 300 nucleotides with an increment of 50 nucleotides and applying a bootstrap threshold of 70% from 100 replicates for scoring of phylogeny violation. Results of the Phylogenetic Signal Scan were presented in the form of a matrix of tree-order positions against the genomic regions, where serotype A isolates are shown in light blue, serotype C in light green, serotype O in red, SAT 1 in yellow, SAT 2 in purple and SAT 3 in orange; (B) As in (A), but this time isolates from QENP and uEA clades were marked in dark green and dark blue, respectively.

