Figure 5.
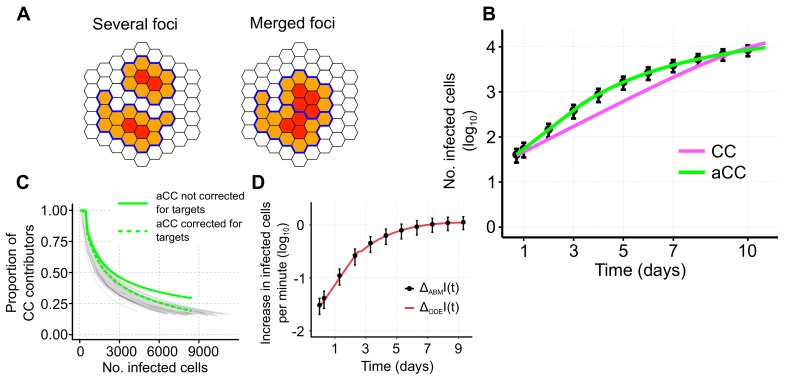
(A) Sketch of the same number of infected cells distributed on two foci that are either separate or build one merged focus. Cells contributing to cell-to-cell (CC) transmission (orange) and non-contributors (red) are indicated. Boundaries of separate foci are marked in blue; (B) Simulated data and model predictions for a scenario allowing for multiple foci growth. Black dots indicate the mean and 95%-confidence interval for the total number of infected cells averaged over 100 individual ABM simulations that were sampled every 24 h. Colored lines indicate the best fit using either the CC- (magenta) or adjusted aCC-model (green). Corresponding parameter estimates are shown in Table 2; (C) Proportion of CC contributors predicted by the adjustment term (green solid line) as defined in Equation (10) in comparison to the proportions inferred from each individual simulation (gray lines). The dashed green line represents the corrected adjustment term multiplied with the proportion of target cells relative to the number of target cells at the beginning of the simulation, i.e., ; (D) Approximate increase of infected cells calculated per minute in the ABM (black dots, mean and -confidence intervals based on 100 simulations) and the ODE model (red line) as defined by Equations (12) and (13), respectively.

