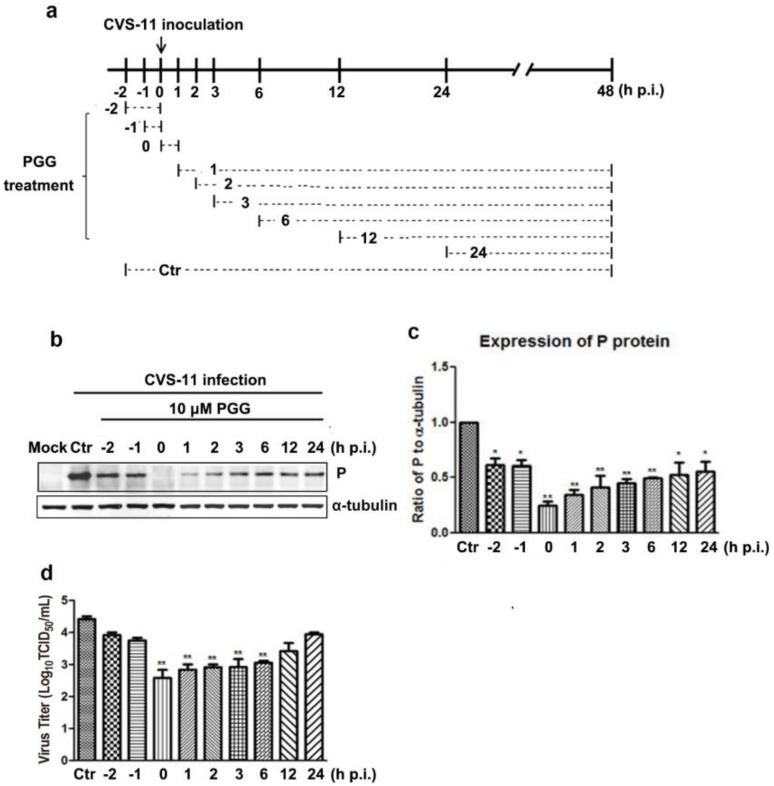
Figure 5.
Time-of-addition assay. (a) Schematic representation of the experimental design. BHK-21 cells were treated with 10 μM PGG at the indicated times. (b) The viral P protein expression level was analyzed by Western blotting at 48 h p.i. (c) The relative expression levels of viral P, normalizing to that of α-tubulin. (d) The virus titers of culture supernatants were determined by TCID50 assay and plotted. Ctr is the abbreviation of control. (* p < 0.05; ** p < 0.01).

