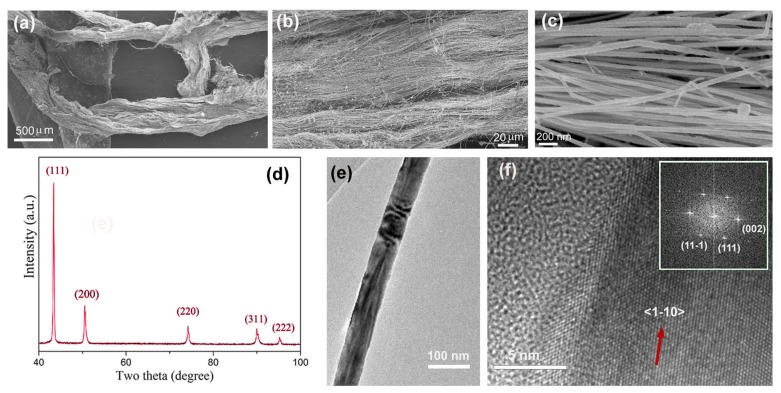
Figure 2.
(a–c) SEM images at different magnifications of the product formed in the presence of oleylamine at 160 °C for 96 h; (d) XRD patterns of the product; (e,f) transmission electron microscopy (TEM) images of a nanowire. Inset of Figure 2f is the corresponding reduced fast Fourier transform image.

