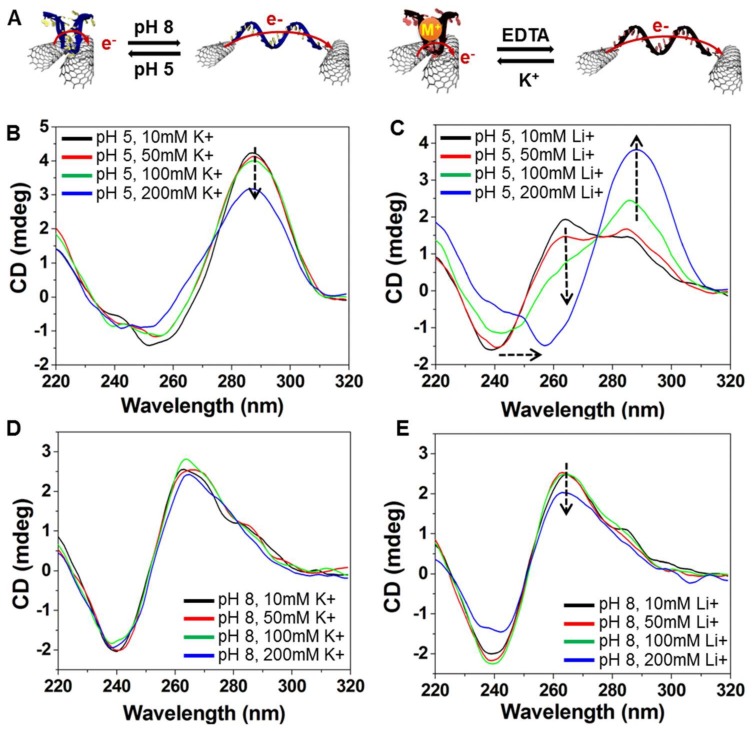
Figure 3.
(A) Schematic representation of conformational change in response to pH and ion (M+) stimuli on i-DNA/f-SWNT (left side) and G-quadruplex/f-SWNT (right side); (B–E) Circular Dichroism (CD) spectra of a mixture of i-DNA/f-SWNT and G-quadruplex/f-SWNT at various concentrations (10, 50, 100, and 200 mM) of K+ and Li+ ions in pH 5 (B,C) and pH 8 (D,E).

