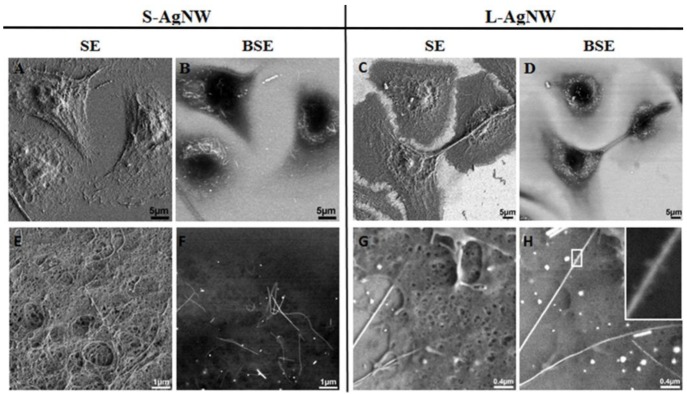
Figure 4.
SEM images showing the uptake, the cellular distribution and changes of short (Left panel: A,B,E,F) and long (right panel: C,D,G,H) AgNWs in human primary keratinocytes cells after 24 h of exposure to 1.5 µg/mL AgNW. Images acquired at low (A–D) and high (E–H) magnification. SEM images were acquired using the secondary electron (SE; Left panel) and backscattered electron (BSE; Right panel) detector respectively. Scale bars represent 5 µm (A–D), 1 µm (E,F) and 0.4 µm (G,H) respectively. Changes in the morphology of AgNWs internalized inside cells is demonstrated (E,H) with bending (F) and a rough surface of internalized AgNW compared to their pristine surface outside cells (G,H). Insert in (H) show magnification of the box area and the modified AgNW surface.

