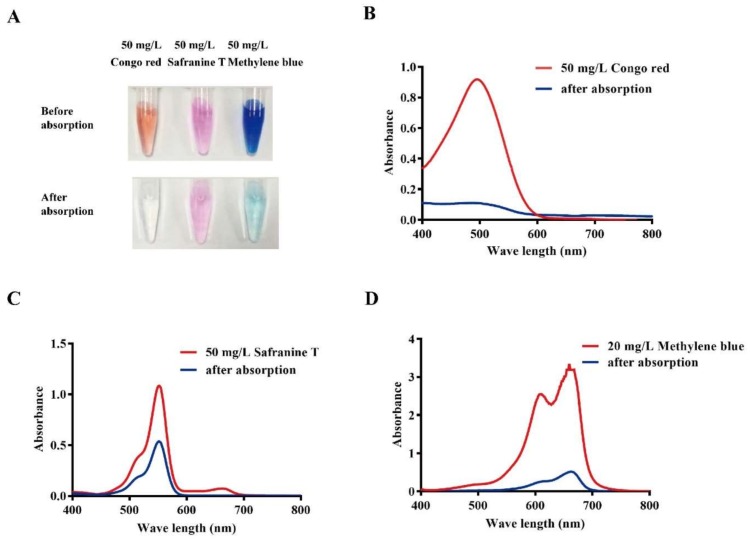
Figure 4.
Characterization of dye removal by Bio-SeNPs. Images of the dye solutions after 1 h adsorption (A); The blue lines represent the spectra of 50 mg/L of congo red (B); safranine T (C) and methylene blue (D) after removal. The red lines are the spectra of standard solutions of 50 mg/L congo red (B); 50 mg/L safanine T (C) and 20 mg/L methylene blue (D), which were used as controls.

