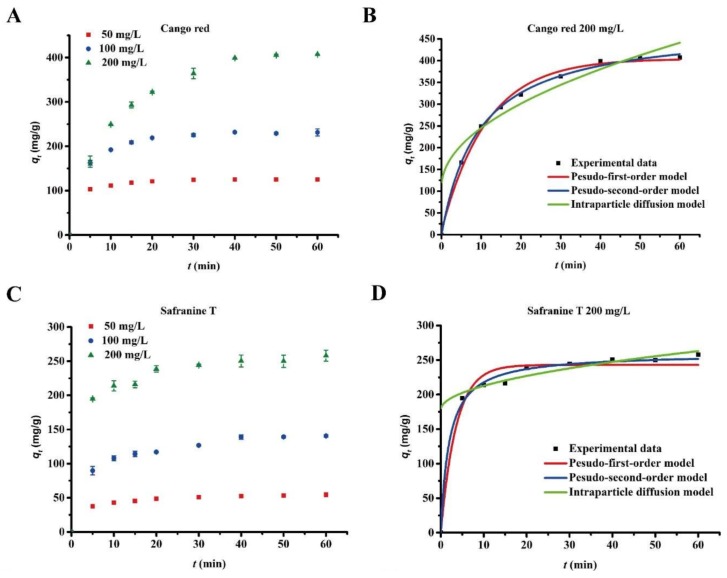
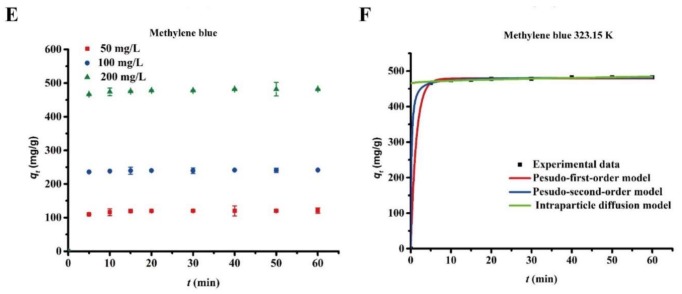
Figure 5.
Effect of contact time on the adsorption of dyes at different initial concentrations. 50, 100 and 200 mg/L of congo red (A); safranine T (C); and methylene blue (E) were completely removed by 0.4 g/L of Bio-SeNPs. Data are shown as the mean ± SD of three replicates. The average values of congo red (B); safranine T (D); and methylene blue (F) with initial concentrations of 200 mg/L were used for the pseudo-first-order, pseudo-second-order and intraparticle diffusion model fitting.


