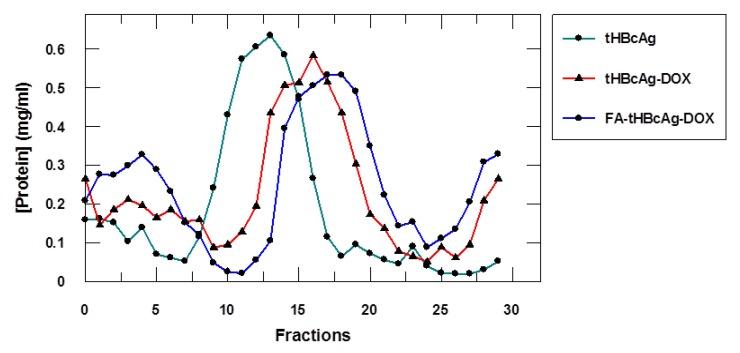
Figure 3.
Migration profile of the tHBcAg VLNPs conjugated with doxorubicin (DOX) and folic acid (FA) in the sucrose gradient. tHBcAg VLNPs (tHBcAg), tHBcAg VLNPs conjugated with DOX (tHBcAg-DOX), and tHBcAg VLNPs conjugated with DOX and FA (FA-tHBcA-DOX) were separated on sucrose gradients, and the total amount of protein in each fraction was measured using the Bradford assay. tHBcAg served as a negative control.

