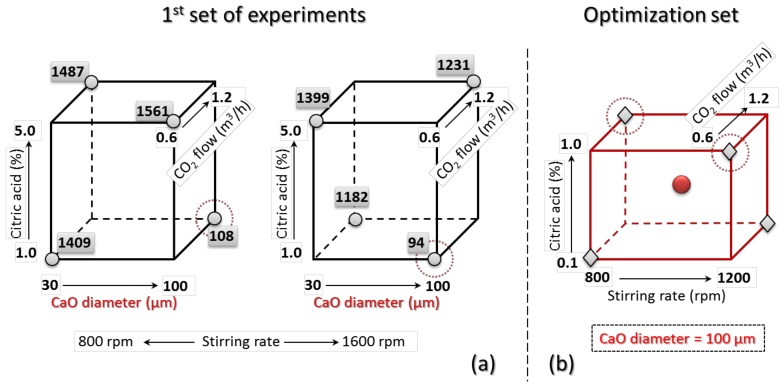
Figure 6.
Cube plots for the DoE: each dimension of the 3D plot represents a different factor, with the selected two levels at the vertices. In (a), the numbers at the corners are the responses (mean size of calcite particles) from the first FFDoE set (the two cube plots differ only for the level of the fourth factor, the stirring rate); (b) optimized FFDoE with highlighted second set of five experimental runs, comprising one for each factor/level combination (diamonds) and one additional mean run (circle); the dotted circles refer to run P10 and P13 in the optimized set (see Table 2), corresponding to runs P6 and P2 of the first FFDoE, respectively; that is, those that gave the two best results.

