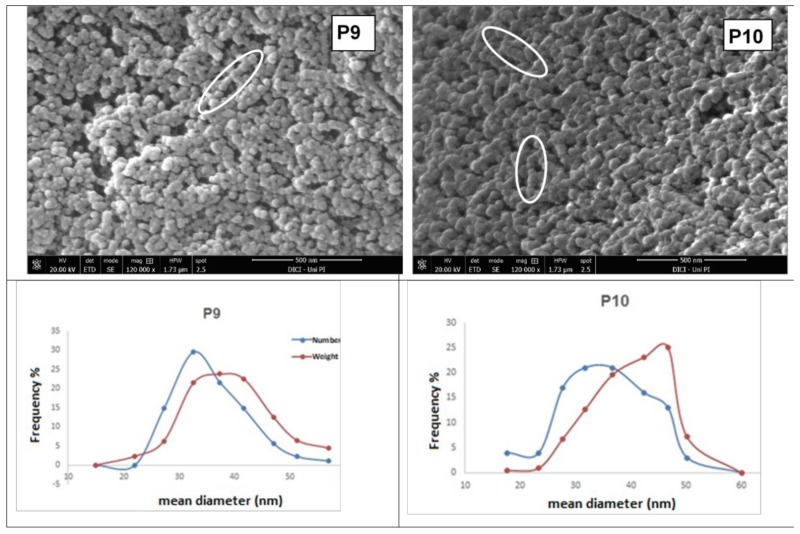
Figure 7.
Above: SEM micrographs of dried powders from samples P9 (left) and P10 (right) with the corresponding particle size distributions below (the red line connects the weight-averaged frequency, the blue line the volume averaged-frequency) from particle counts and sizing obtained through image analysis. Circles evidence “chain-like” assemblies of nanoparticles.

