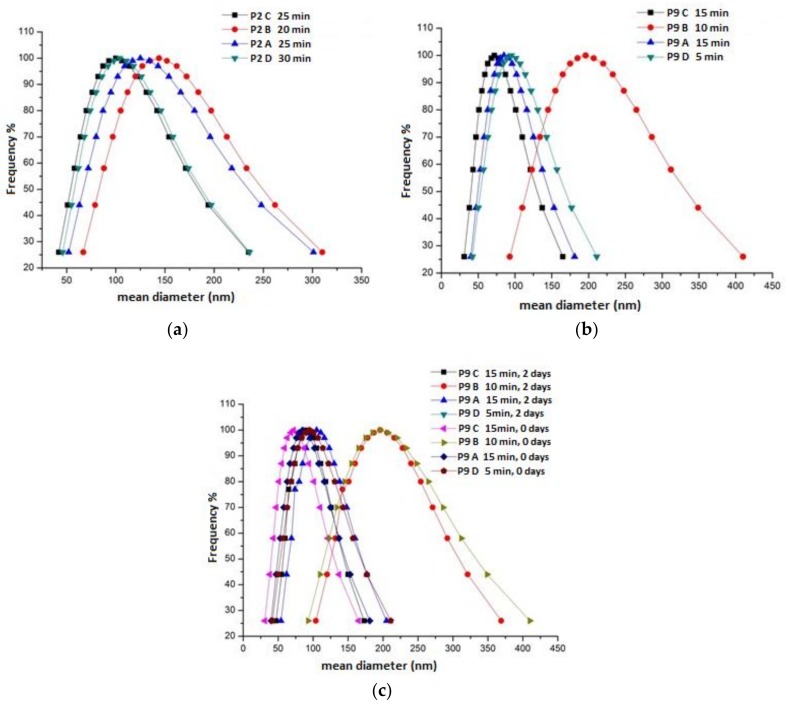
Figure 9.
Particle size distribution curves of the optimized aqueous CCNP suspensions P2 and P9. Each curve shows the size distribution at the specified time elapsed after addition of the colloidal stabilizer: (a) sample P2; (b) sample P9; (c) sample P9 (two sets of measurements, right after and two days after sonication, respectively).

