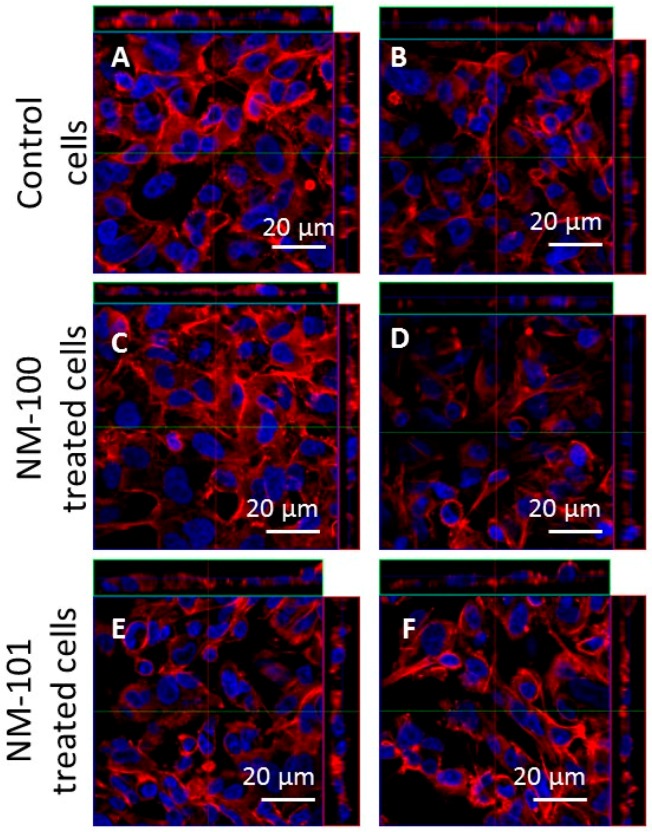
Figure 7.
Ortho-images of representative LSCM micrographs of ALI cultures. Cells were stained with Hoechst 33342 (nuclei, in blue) and rhodamine phalloidin (F-actin, in red). Scale bars: 20 μm (63× objective lens). The left column shows the results obtained for the inoculation method; the right column shows those for the aerosol exposure method. (A,B) ALI culture control cells. (C,D) ALI cultures exposed to NM-100; (E,F) ALI cultures exposed to NM-101. Abbreviations: ALI, air–liquid interface.

