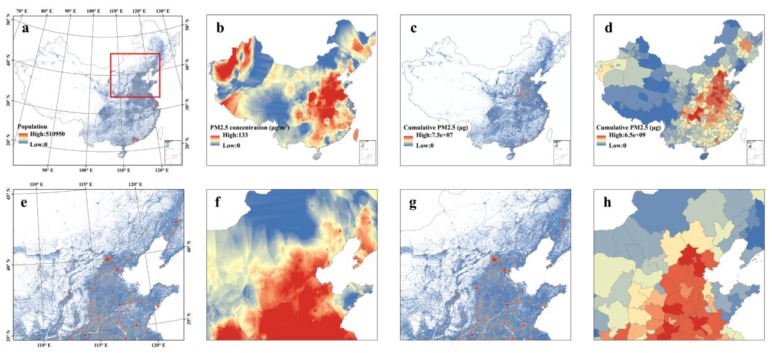
Figure 2.
Different facets of population exposure to PM2.5. (a) Map of population distribution in China on 1 March 2016 (11:00 a.m.). (b) Map of PM2.5 concentration levels in China on 1 March 2016 (11:00 a.m.). (c) Map of cumulative inhaled PM2.5 masses in China based on the MPL data on 1 March 2016. (d) Map of cumulative inhaled PM2.5 in China based on the census data on 1 March 2016. (e–h) show the insets from (a–d) for part of the Northern China.

