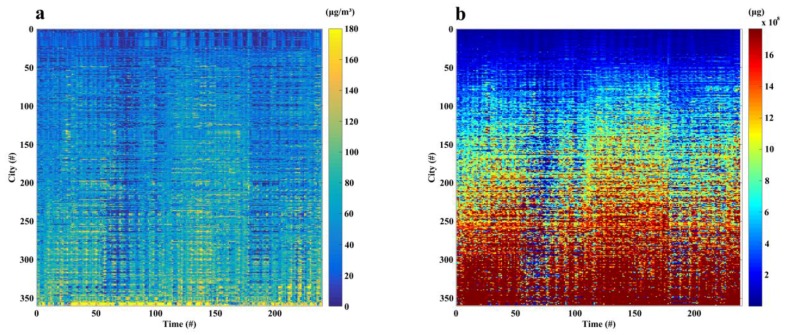
Figure 3.
The estimated population-weighted PM2.5 concentrations (a) and cumulative inhaled PM2.5 masses (b) for 359 cities in China with every 3 h from 1 March to 31 March 2016. Note that the x axis represents the time from the first 3-h (2:00 a.m. 1 March 2016) to the last 3-h (23:00 p.m. 31 March 2016), and y axis represents the order of 359 cities.

