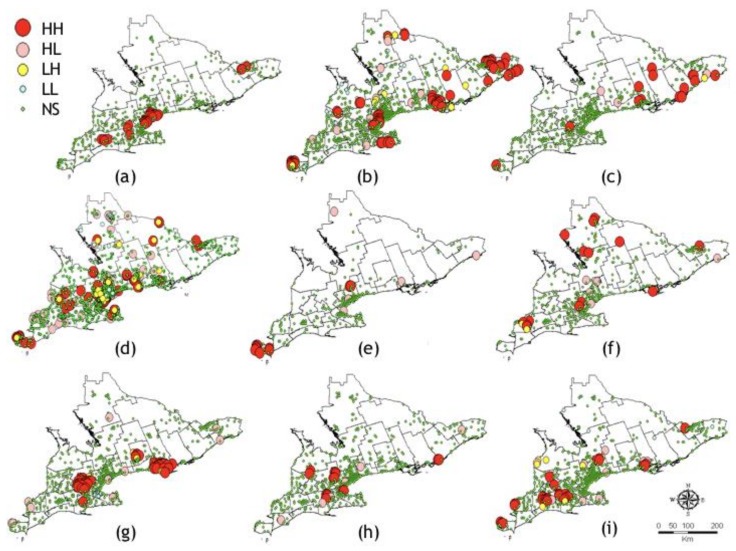
Figure 3.
LISA cluster analysis of MMTN data. (a) Ae. japonicus; (b) Ae. vexans; (c) An. quadrimaculatus; (d) Cx. pipiens/restuans; (e) Cx. salinarius; (f) Och. canadensis; (g) Och. stimulans; (h) Och. triseriatus; (i) Och. trivittatus. HU boundaries are shown with a solid black line. Abbreviations, HH, high–high; HL, high–low; LH, low–high; LL, low–low; NS, not significant.

