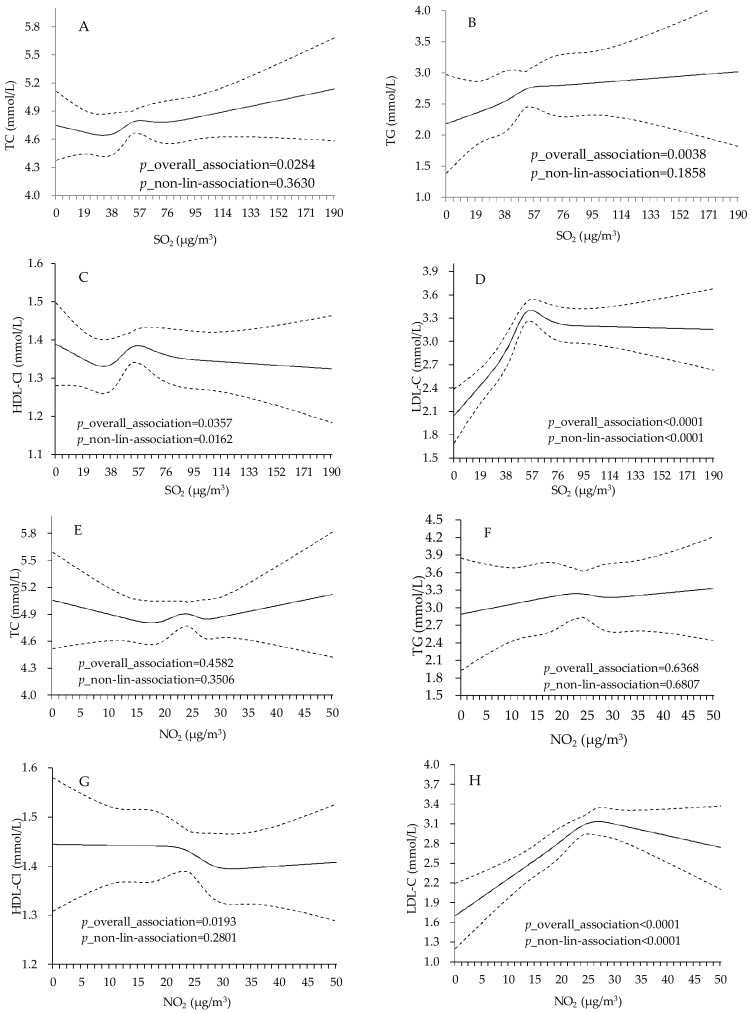
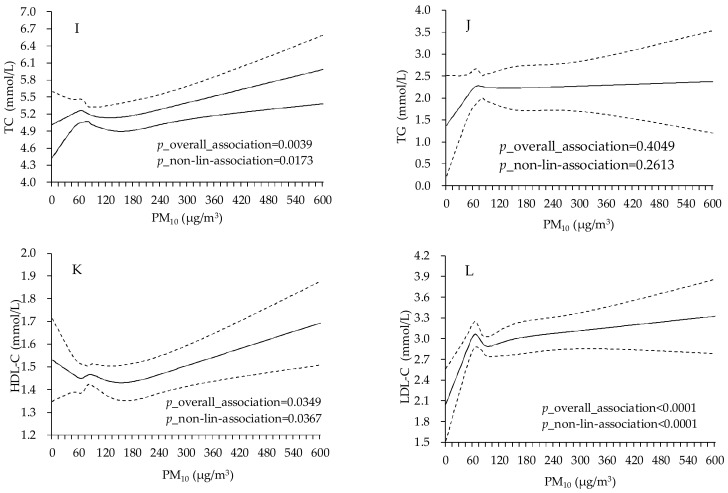
Figure 3.
Adjusted dose-response association between PM10, SO2, NO2 and lipid profiles among type 2 diabetes patients in Jinchang, China (n = 3912). Adjusted for age, sex, education, smoke status, alcohol drink, occupation, BMI and FPG fitted simultaneously. (A–D) represent the dose-response association between SO2 and TC, TG, HDL-C and LDL-C; (E–H) represent the dose-response association between NO2 and TC, TG, HDL-C and LDL-C; (I–L) represent the dose-response association between PM10 and TC, TG, HDL-C and LDL-C; Solid lines present the predicted values of lipid levels in different concentration of air pollutants. Dashed lines are 95 percent confidence intervals.


