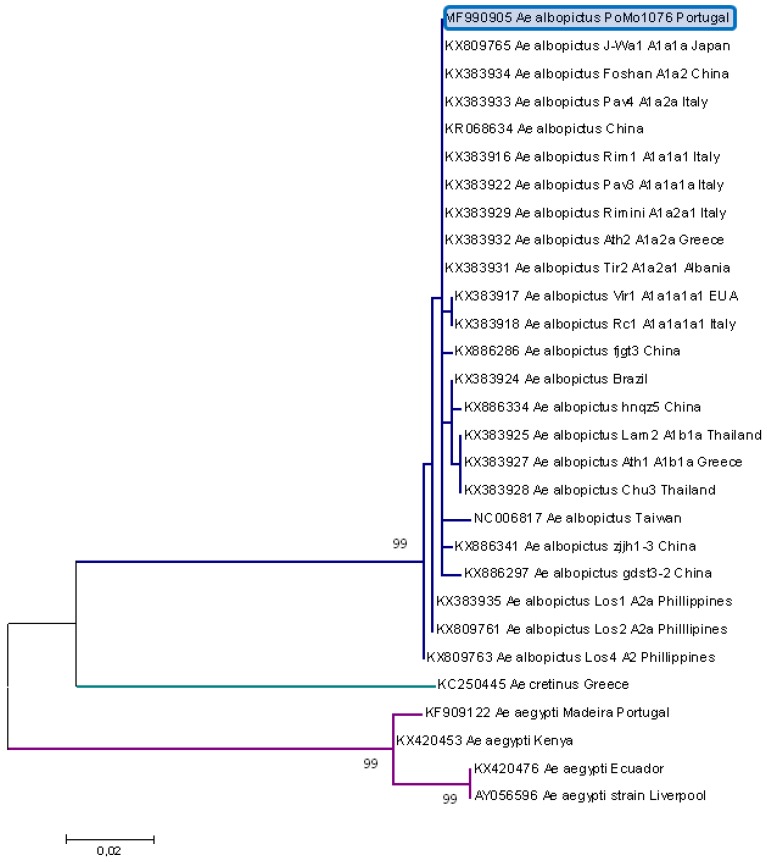
Figure 2.
Phylogenetic analysis of Ae. albopictus sequences using partial COI sequence region. The maximum likelihood phylogenetic tree was inferred on the basis of 29 partial cytochrome oxidase I (COI) nucleotide sequences (660 bp) by using Molecular Evolutionary Genetics Analysis (MEGA) version 7 software. Distance matrices were calculated using the T92+G model. Bootstrap values obtained from 1000 replicate trees are shown for key nodes (more than 70%). The scale is shown at the bottom as substitutions per site. GenBank accession number and origin are indicated. The Ae. albopictus sequence related to this work is highlighted in blue.

