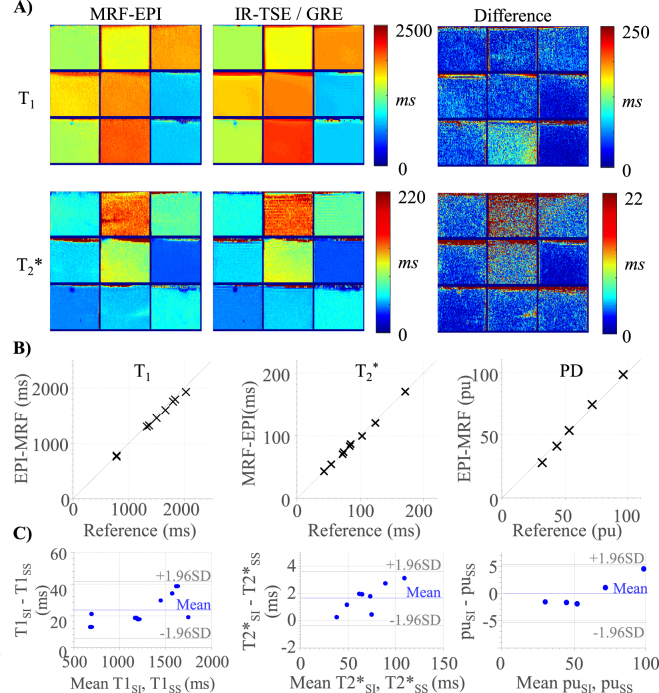
Figure 3.
(A) T1 and T2* maps obtained in phantom measurements using slice-interleaved MRF-EPI and the respective reference method IR-TSE and GRE. (B) Comparison of T1, T2* and proton density (PD) values of slice-interleaved MRF-EPI with the reference methods showing nearly identical average quantification in all phantoms. (C) Bland-Altman plot showing good agreement between the slice-interleaved MRF-EPI (T1SI, T2*SI) and the single-slice MRF-EPI (T1SS, T2*SS).

