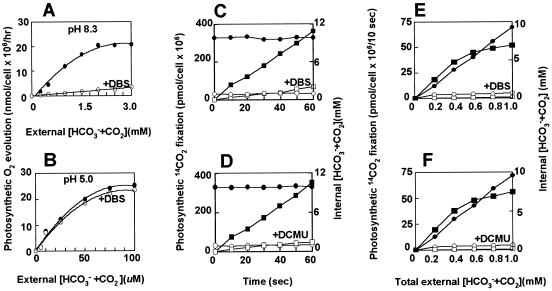
Figure 1.
A and B, Rates of photosynthetic oxygen evolution in response to external DIC concentration at pH 8.3 (A) and pH 5.0 (B) in the absence (•) and presence (○) of DBS. C to F, Internal inorganic carbon concentration by P. micans in the absence (•) and presence (○) of DBS (C and E) and in the absence (•) and presence (○) of DCMU (D and F) and photosynthetic 14CO2 fixation in the absence (▪) and presence (□) of DBS (C and E) and in the absence (▪) and presence (□) of DCMU (D and F). The final cell concentration was 2.5 × 10⁶ cells mL−1. In C and D, the intracellular water space was 0.87 μL and the total water space was 1.75 μL; in E and F, the intracellular water space was 0.53 μL and the total water space was 1.08 μL (n = 3). In A and B, the temperature was 15°C ± 1°C, and the PFD was 500 μmol m−2 s−1; in C and D, the pH was 8.3, the temperature was 15°C ± 1°C, and the PFD was 500 μmol m−2 s−1; in E and F, the temperature was 15°C ± 1°C and the PFD was 500 μmol m−2 s−1.

