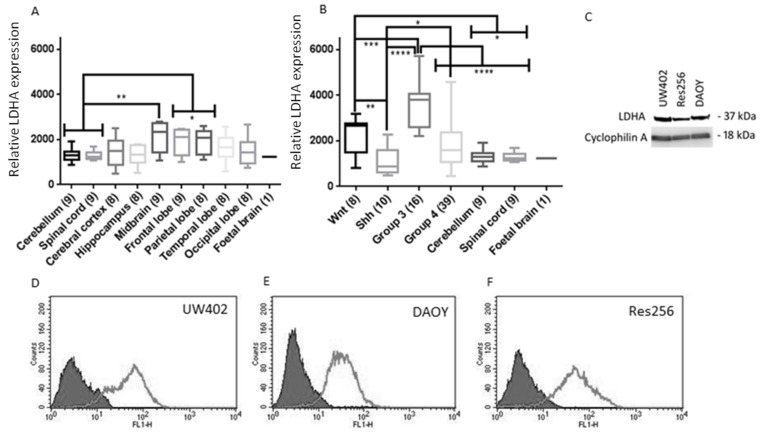
Figure 1.
LDHA expression in MB and non-neoplastic tissue and cell lines. (A,B) LDHA expression in CNS tissues from data extracted using the R2 data base. The number of samples per tissue is stated in parentheses. Graphs show box plots (highest value, lowest value, upper quartile, lower quartile, interquartile range and median). (A) LDHA expression in non-neoplastic CNS tissues. LDHA expression in cerebellum and CNS were compared to every other CNS tissue; (B) LDHA expression in a range of non-neoplastic CNS tissues and MB subgroups. LDHA expression was compared between MB subgroups and compared to normal cerebellum and spinal cord; (C) Representative Western blot of lysates from MB cell lines UW402, Res256 and DAOY. 50µg of protein was loaded into each well and the blot was probed for LDHA (37 kDa) and cyclophillin A (18 kDa) as a loading control; (D–I) Flow cytometry analysis of LDHA expression in MB cell lines; solid grey = negative control, light grey line = LDHA expression (D) UW402; (E) DAOY; (F) and Res256; (G) Percentage of cell populations expressing LDHA. (H) Mean LDHA expression (fluorescence intensity). Graphs show mean with SEM. Not significant p > 0.05, * p ≤ 0.05, ** p ≤ 0.01, *** p ≤ 0.001, **** p ≤ 0.0001.


