Figure 2.
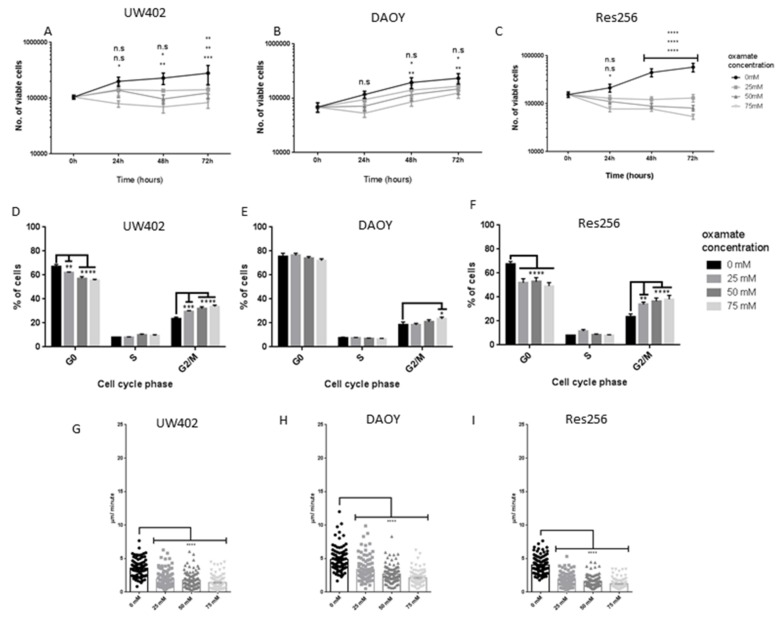
Effects of oxamate on MB proliferation and motility. MB cell lines were grown in the presence of 0 mM, 25 mM, 50 mM or 75 mM oxamate. (A–C) Number of viable cells 0–72 h after treatment counted by Vi-Cell automated cell counter (A) UW402, (B) DAOY and (C) Res256; (D–F) Mean percentage of cells in G0, S and G2/M phases of the cell cycle 48 h after treatment (D) UW402, (E) DAOY, (F) Res256; (G–I) Average velocity (µm/second) of individual (G) UW402, (H) DAOY and (I) Res256 cells over 24 h. Cells were imaged every 30 minutes and tracked manually using Volocity software. Graphs show mean with SEM. Oxamate treated samples were compared to the untreated control at each time point, not significant p > 0.05, * p ≤ 0.05, ** p ≤ 0.01, *** p ≤ 0.001, **** p ≤ 0.0001.

