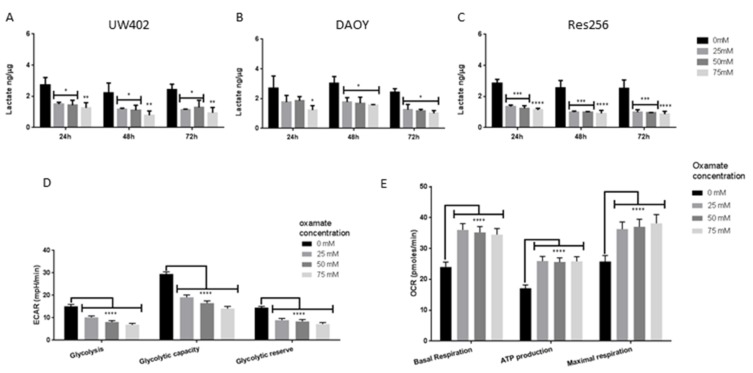
Figure 3.
Effects of oxamate on MB metabolism. MB cell lines were grown in the presence of 0 mM, 25 mM, 50 mM or 75 mM oxamate. (A–C) Lactate concentrations of lysates prepared from (A) UW402, (B) DAOY, and (C) Res256 cells treated for 24–72 h. Lactate concentrations were normalised to the protein concentrations of each sample. (D) ECAR (mpH/min) of UW402 cells treated for 24 h. Glycolysis, glycolytic capacity and glycolytic reserve calculated from changes in ECAR with the addition of glucose, oligomycin and 2-DG. (E) Oxygen consumption rate (pmoles/min) of UW402 cells treated for 24 h. Basal respiration, ATP production and maximal respiration calculated from changes in OCR with the addition of oligomycin, FCCP, rotenone and antimycin A. Oxamate-treated samples were compared to the untreated control at each time point. Graphs show mean with SEM, not significant p > 0.05, * p ≤ 0.05, ** p ≤ 0.01, *** p ≤ 0.001, **** p ≤ 0.0001.

