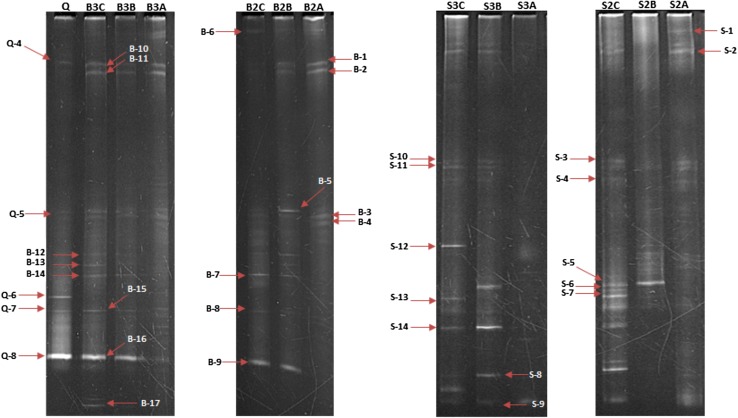
Fig. 7.
DGGE profiles of B2, B3, S2, and S3 treatments of lab scale microcosms. A, B, and C Letters after the name of each treatment, respectively, refer to the first, day 45, and day 60 of sampling of each treatment. Q is referred to the inoculated consortium in B3 and S3 treatments. In each lane, bands pointed to arrows were re-amplified by non GC clamp primer and sequenced

