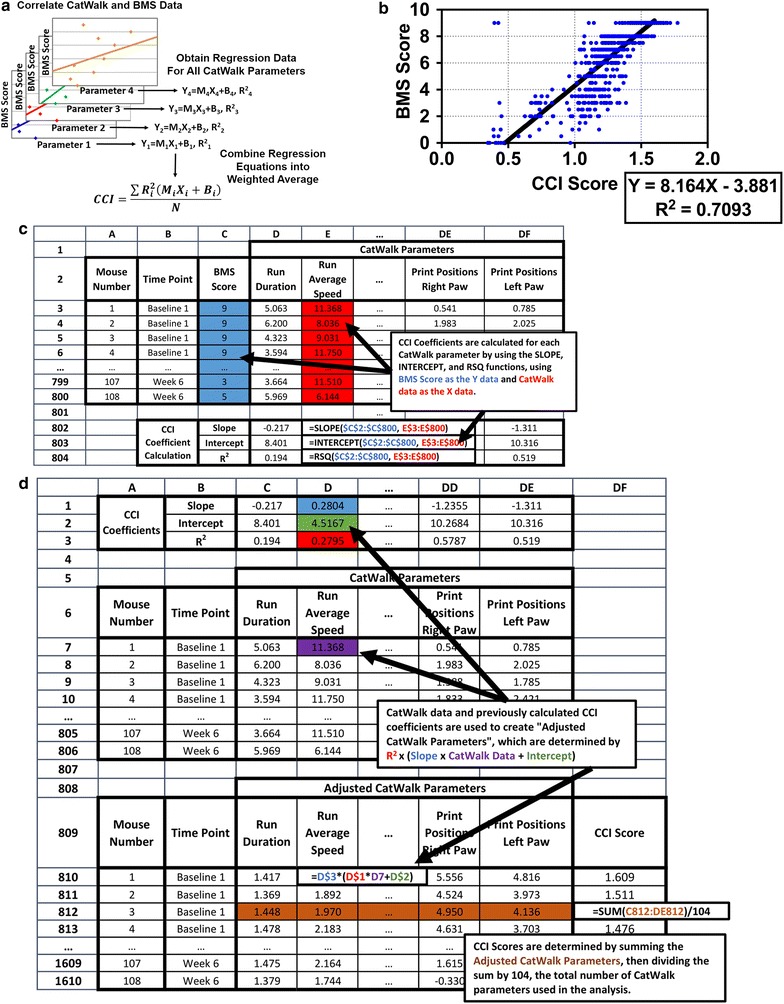
Fig. 1.

a Schematic of how CCI scores are calculated. Data from N CatWalk parameters is correlated with BMS data using linear regression. Each parameter produces a slope (M), Y-Intercept (B), and R2, which are listed in Table 1. The CCI score is then determined using a weighted average of each CatWalk parameter using MX + B linear equations multiplied by R2 as the weighting factor. b Plot of CCI scores against corresponding BMS scores. CCI scores correlate with BMS scores with an R2 value of 0.7093, slightly higher than the CatWalk parameter with the highest R2 value (Step Sequence Regularity Index, R2 = 0.7048). c Example of how the CCI coefficients are determined from BMS to CatWalk data using a spreadsheet. Linear regressions are performed for each CatWalk Parameter using the SLOPE, INTERCEPT, and RSQ functions. d Example of how CCI scores are calculated from CCI coefficients and CatWalk data. Each CatWalk parameter is multiplied by its CCI coefficients to create an “Adjusted CatWalk Parameter”. The adjusted CatWalk parameters are summed and divided by 104, the number of CatWalk parameters used to create the CCI coefficients
