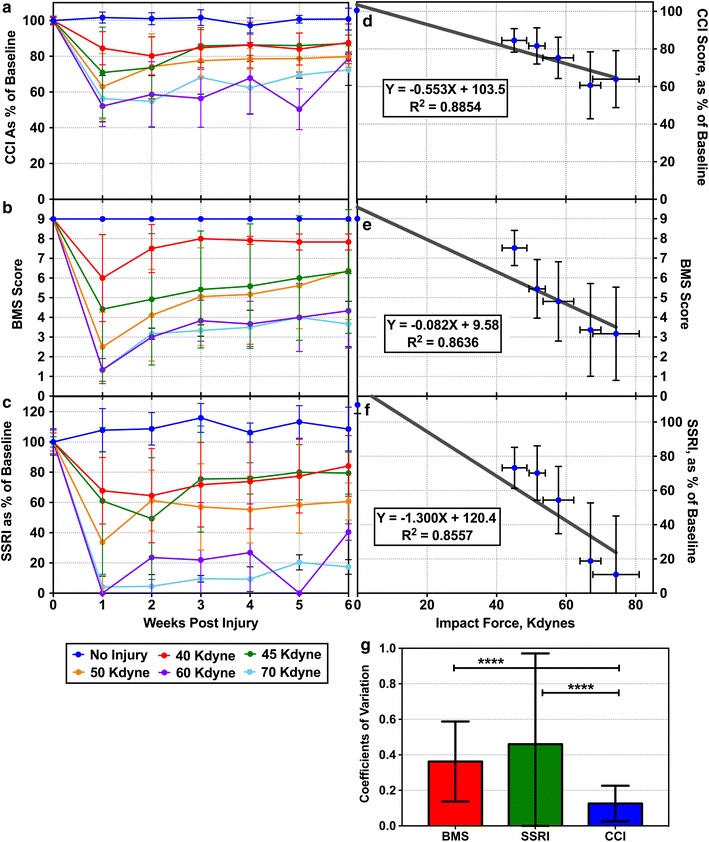
Fig. 2.

a–c Comparison of CCI to BMS and SSRI. Mice were given SCI at different impact forces and monitored by BMS and CatWalk methods for 6 weeks post-injury. CCI scores were calculated and plotted in (a), while BMS scores are plotted in (b). Step Sequence Regularity Index (SSRI) is plotted in (c) to represent the CatWalk parameter that mostly closely correlated with BMS score. All three scoring methods show similar patterns of motor function recovery. d–f Average CCI, BMS, and SSRI scores at each injury level were plotted against impact. CCI produces a slightly better correlation (R2 = 0.8854) than BMS (R2 = 0.8636) or SSRI (R2 = 0.8557). g Coefficients of variation (CV) at each time point in plots (a–c) were determined and averaged. The CCI method has a significantly smaller CV than BMS or SSRI (P < 0.0001 for each, determined by unpaired 2-tailed T Test). All error bars represent sample standard deviation
