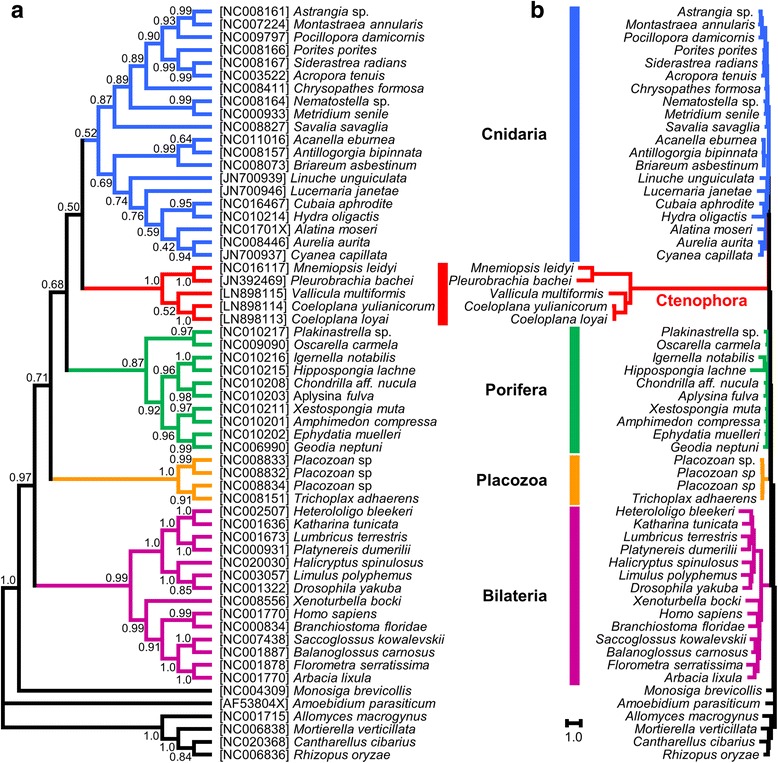
Fig. 3.

Phylogenetic position of Ctenophora within Metazoa using the most conserved mt genes. Bayesian tree reconstructed under the CAT+GTR + Γ mixture model from the seven most-conserved ctenophore genes (cob, cox1–3, nad1, nad3 and nad5). a Topology and posterior support values. b Tree with branch length. The long ctenophore branches, in blue, exemplify the fast evolutionary rate observed in this phylum compared to all other animal groups
