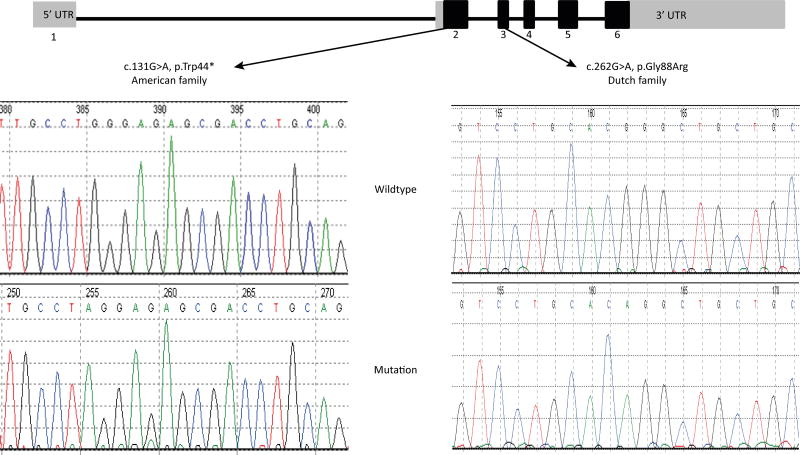
Figure 4. CYB561 mutations.
The upper part shows the structure of the CYB561 gene, with the positions of the identified mutations indicated. Grey boxes indicate 5’ and 3’ UTRs (untranslated regions), black boxes indicate coding exon sequences. The lower part depicts spherograms showing the Sanger sequencing data of the patients (mutation) and controls (wild type).

