Fig. 2.

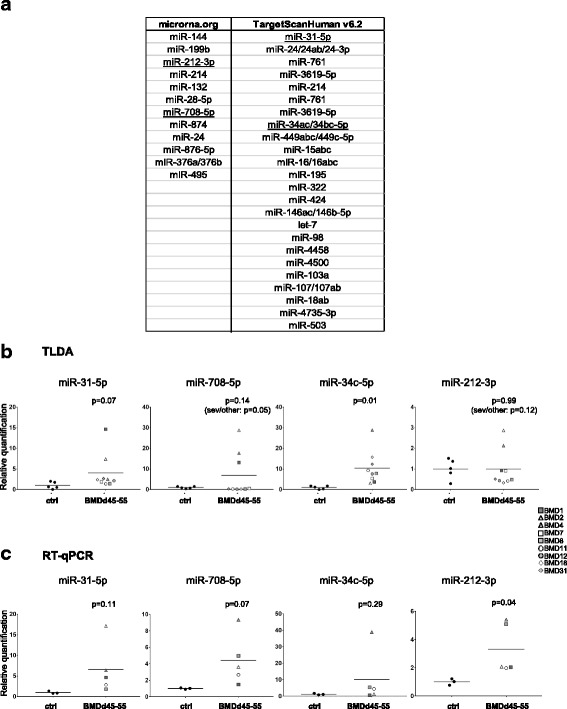
Selection of candidate miRNAs. a In silico screening of miRNAs that could target NOS1 (TargetScan Human and microRNA.org). Candidate miRNAs are underlined. TLDA (Additional file 2, TLDA A2, B2) (b) and individual RT-qPCR (c) values of candidate miRNA expression in healthy subject biopsies (ctrl, black circle) and BMDd45-55 patients with asymptomatic phenotype (gray circle), moderate phenotype (gray square), severe phenotype (gray triangle), or not determined phenotype (gray hexagon); data are normalized on average of control expression. Lines represent average of each group. Individual RT-qPCR data are expressed as relative quantification using miR-30b as normalizer, normalized on average of control expression
