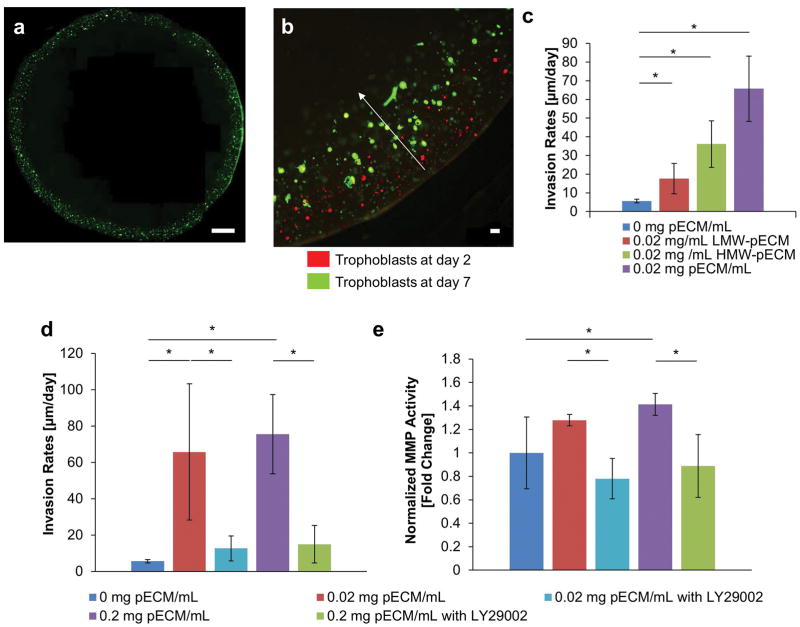
Figure 4. Effect of pECM on Cytotrophoblast Invasion.
(a) Overview of Bioprinted Placenta Model. The bioprinted placenta model (BPM) was based on previously published work that has a layer of cytotrophoblasts along the periphery of a cylindrical disc (green) with a chemoattractant at the center. Placental BM proteins were incorporated with GelMA throughout BPM. (b) Representative Images of Cytotrophoblast Invasion. By taking images of cytotrophoblasts at day 2 (red) and day 7 (green), we observed the shift in the invasion fronts. We calculated the invasion rates by taking the differences between the invasion fronts and average over time. (c) Effect of Fractionated pECM on Invasion Rates of Cytotrophoblasts. The cytotrophoblasts bioprinted in complete pECM has the highest invasion rates, followed by HMW-pECM and then LMW-pECM (n=3). (d) Trophoblast Invasion Rates as a Function of pECM and PI3K Inhibitor. The pECM at both dosages (0.02 and 0.2 mg pECM/mL) significantly increased invasion rates of cytotrophoblasts compared to the control BPM without any pECM. The addition of LY294002, a PI3K inhibitor, significantly reduced the effect of pECM on the invasion rates when compared to their respective dosage of pECM. Moreover, there’s no statistically significant differences between the invasion rates of control BPM with no pECM and groups treated with LY294002 (n=3), which indicated that the effect of pECM was completely removed by LY294002. (e) Effect of pECM and PI3K Inhibitor on MMP Activities. A similar pattern was observed in the amount of MMP activity where pECM increased MMP activities significantly at both dosages (0.2 and 0.02 mg pECM/mL) and the addition of PI3K inhibitor significantly reduced the effect of pECM. (n=3).

