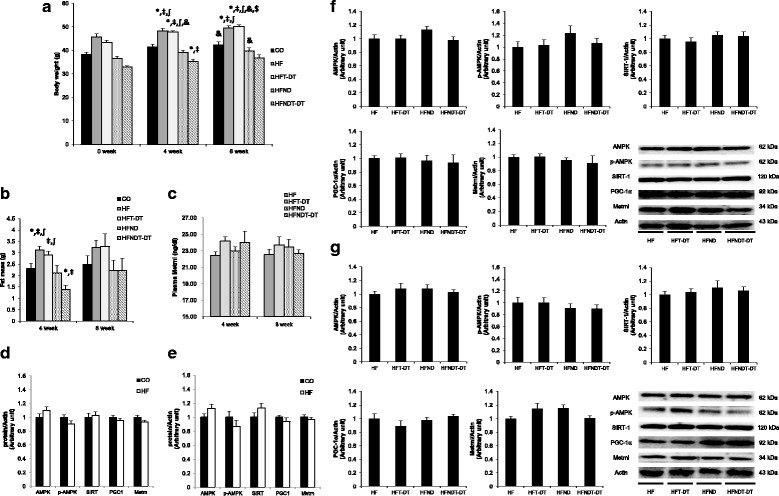
Fig. 3.

Changes after 4 and 8 weeks of detraining. Changes of body weight (a), fat mass (b), plasma Metrnl protein levels (c), soleus muscle proteins level of CO and HF group after 4-week detraining (d), soleus muscle proteins level of CO and HF group after 8-week detraining (e), soleus muscle proteins level of experimental groups after 4-week detraining (f), and soleus muscle proteins level of experimental groups after 8-week detraining (g) are presented. Values are presented mean ± SE. CO; Normal-diet + sedentary group, HF; High-fat diet + sedentary group, HFT-DT; HF + Detraining group, HFND; a normal diet + sedentary group (dietary change group), HFNDT-DT; HFND + Detraining group. * p < 0.05; vs CO group, ⧧ p < 0.05; vs HFND, ∫p < 0.05; vs HFNDT, & p < 0.05; vs 0-week, $ p < 0.05; vs 4-week
