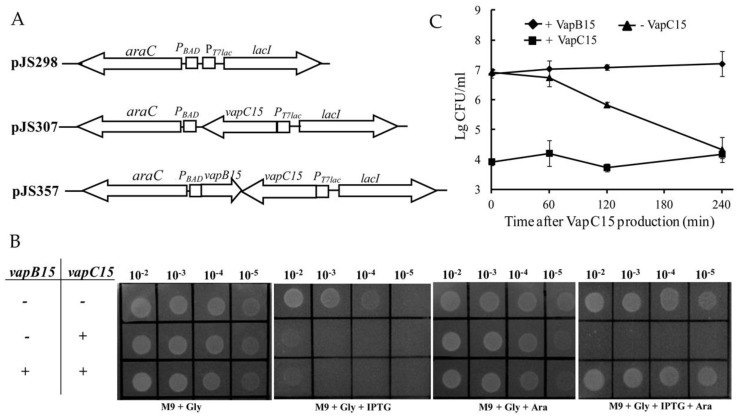
Figure 1.
Effects of VapB15 and VapC15 on E. coli growth. (A) Schematic diagram illustrating the structure of the selection expression plasmids. (B) Drop dilution assays for the effects of ectopic production of VapBC15 components on E. coli growth. + or − indicates the presence or absence of the vapBC15 genes in E. coli BL21(DE3) cells, (C) Growth-rescue analyses for toxic effect of VapC15 using E. coli BL21(DE3) cells containing pJS357. + indicates the induction of VapB15 or VapC15 expression. − indicates the stop of VapC15 expression. Data points represent the means of three independent cultures and the error bars represent standard deviation (SD).

