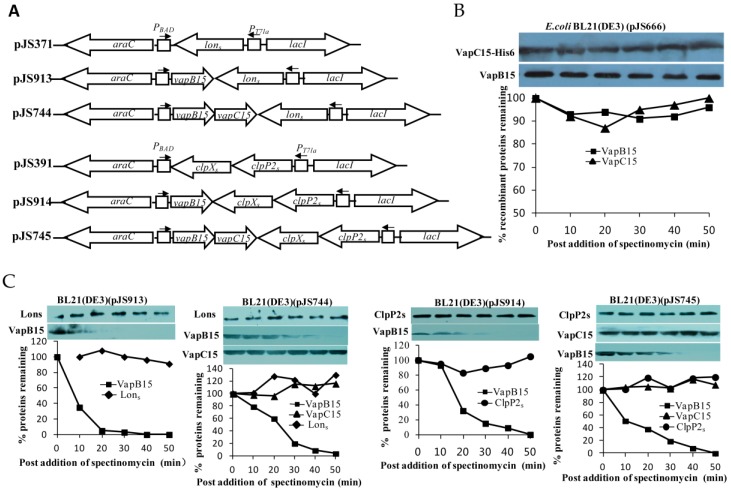
Figure 5.
Western blot analyses for the sensitivity of VapB15 and VapC15 to ClpPXP2s and Lons. (A) Schematic diagram showing the structure of proteolytic activation plasmids. (B) Stability of VapBC15 proteins in E. coli cells. The cells of E. coli BL21 (DE3)(pJS666) (see Figure 2) were grown, induced and translationally stalled as described in Materials and Methods. The treated cells were subjected to Western blot analysis to monitor VapB15 and VapC15 with the respective antibodies. The graph below represents the percentages of the indicated protein amount at each time point compared to that at time zero. (C) Stability of the VapBC15 proteins towards ClpPXP2s and Lons. The E. coli cells containing the corresponding plasmids were treated similarly as in (B), and subjected to Western blot analysis using the respective antibodies.

