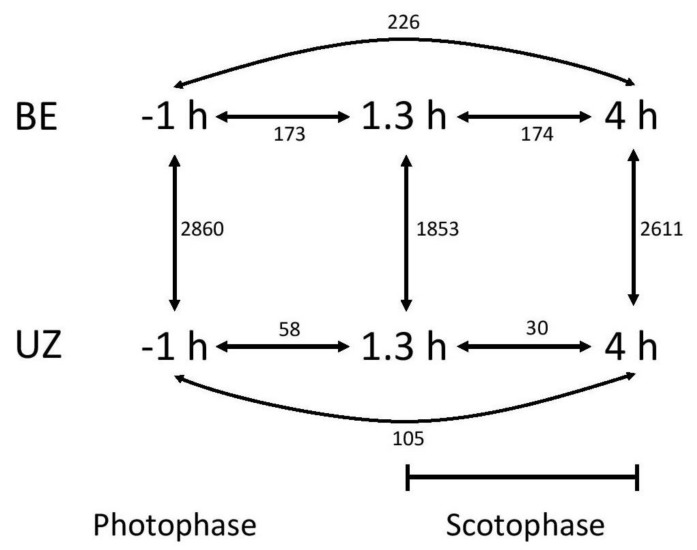
Figure 2.
Schematic of specific contrasts tested in differential expression analysis. Within strain, comparisons were made between each pair of time points (photophase vs. 1.3 h of scotophase, photophase vs. 4 h of scotophase, and 1.3 vs. 4 h of scotophase). Between-strain, comparisons were made at each time point (BE vs. UZ). Numbers shown are total numbers of differentially expressed transcripts in each contrast.

