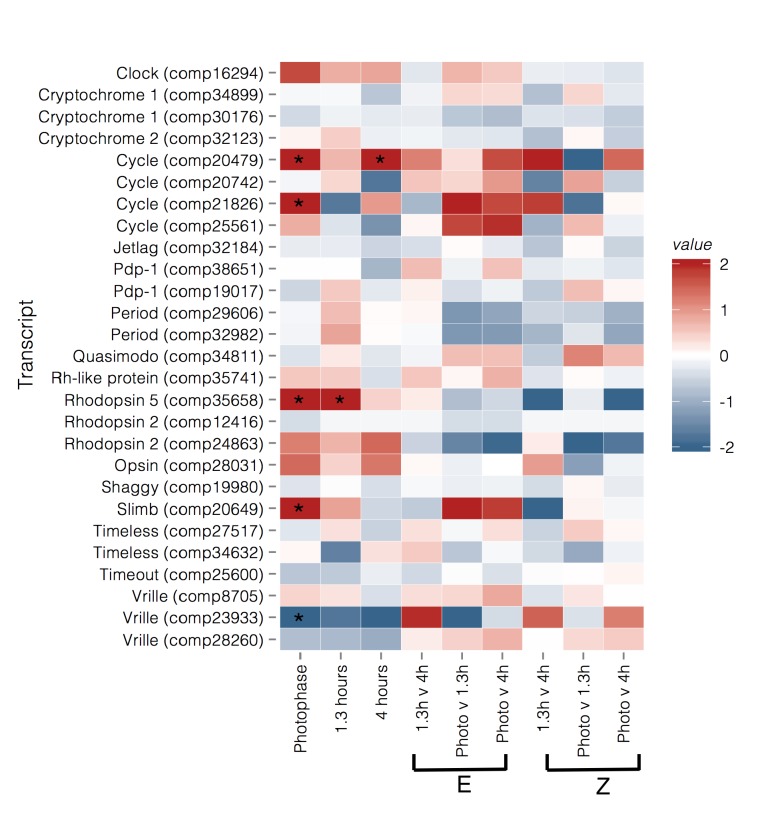
Figure 4.
Heatmap of relative expression of genes in the circadian pathway and related photoreceptors in each contrast. Values are log FC. Photophase, 1.3 h, and 4 h contrasts are between strain with red indicating upregulation in BE (early daily and seasonal mating), and blue indicating upregulation in UZ (late daily and seasonal mating). For within strain/between time point contrasts the red color indicates upregulation at the first time point, and blue color indicates upregulation at the second time point. Log FC were capped to a minimum of −2 and a maximum of 2 for visualization purposes. Asterisks indicate genes that are significantly differentially expressed (q-value < 0.05) for a given contrast.

