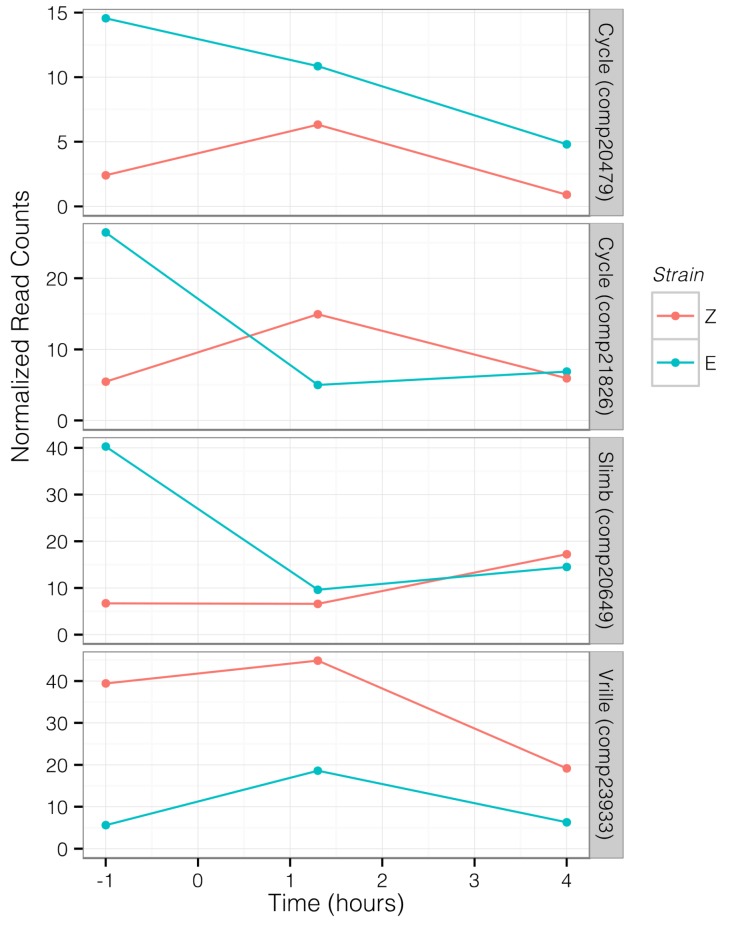
Figure 5.
Trajectory of circadian transcript expression levels through time for transcripts that were significantly differentially expressed between strains. Each line represents a single component, with normalized counts at each time point averaged across libraries. Data collection time points were 1 h before scotophase, 1.3 h into scotophase, and 4 h into scotophase. Red indicates values for UZ, blue indicates BE.

