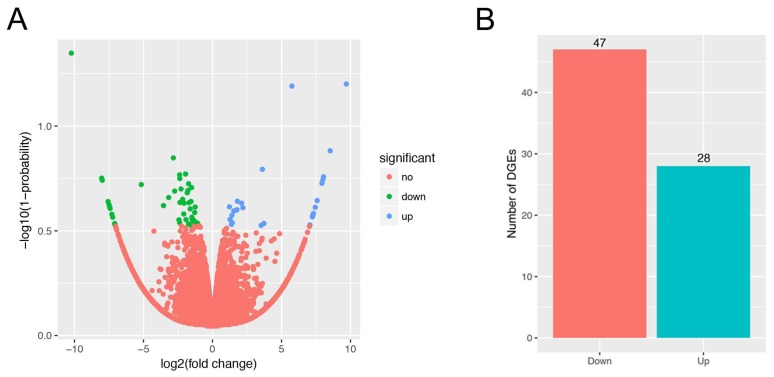
Figure 1.
Identification of differentially expressed genes (DEGs). (A) Volcano plot showing DEGs in higher (H) and lower (L) groups. The x axis represents the value of log2 (L/H), and the y axis represents the value of −log10 (1-probability). Red, green, and blue dots represent unchanged, downregulated, and upregulated DEGs between the H and L groups; (B) Statistics of DEGs between the H and L groups. The x axis represents downregulated and upregulated genes, and the y axis represents the number of DEGs.

