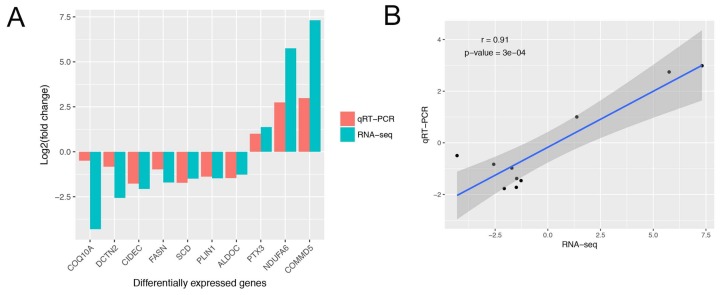
Figure 2.
Real time quantitative reverse-transcription polymerase chain reaction (qRT-PCR) validation of differentially expressed genes (DEGs) and correlation with RNA sequencing (RNA-Seq). (A) Validation of the DEGs by qRT-PCR (n = 3). The x axis represents DEGs and the y axis represents the log2 (L/H) for qRT-PCR and RNA-Seq; (B) Correlation analysis of DEGs between qRT-PCR and RNA-Seq. The x and y axes represent the log2 (L/H) measured by RNA-Seq and qRT-PCR, respectively.

