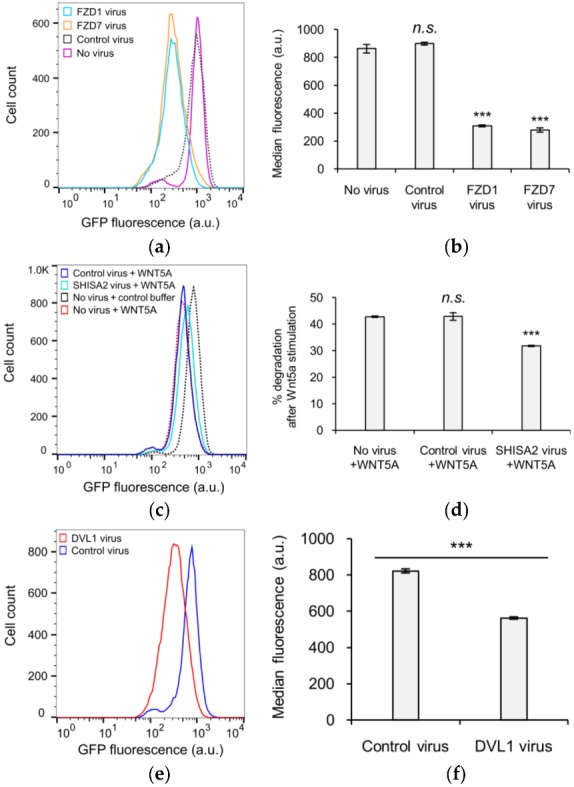
Figure 3.

Functional characterization of KIF26B-C in the degradation reporter assay. (a) Flow cytometry histograms depicting the effect of ectopic FZD1 and FZD7 expression on GFP-KIF26B-C degradation (a.u. = arbitrary units); (b) Quantification of (a) (a.u. = arbitrary units). Median fluorescence is used for quantification because the experiment involved direct comparison of different cell lines, unlike the experiments presented in previous figures where % degradation was used to specifically express the effects of WNT5A stimulation within the same cell lines. Error bars represent ± SEM calculated from three independent replicates of each experimental condition. Statistical analysis was performed with unpaired t-test (n.s. = not significant; *** p value < 0.001 vs. no virus); (c) Flow cytometry histograms depicting the effect of ectopic SHISA2 expression on GFP-KIF26B-C degradation (a.u. = arbitrary units). Control buffer traces for “Control virus” and “SHISA2 virus” lines are similar to that of the “No virus” and thus not shown for visual clarity. However, data from the respective buffer control experiment for each virus-infected line were used for the quantification shown in (d); (d) Quantification of (c). Error bars represent ± SEM calculated from three independent replicates of each experimental condition. Statistical analysis was performed with unpaired t-test (n.s. = not significant; *** p value < 0.001 vs. no virus, +WNT5A); (e) Flow cytometry histograms depicting the effect of ectopic DVL1 expression on GFP-KIF26B-C degradation (a.u. = arbitrary units); (f) Quantification of (e) (a.u. = arbitrary units). Error bars represent ± SEM calculated from three independent replicates of each experimental condition. Statistical analysis was performed with unpaired t-test (*** p value < 0.001 vs. control virus).
