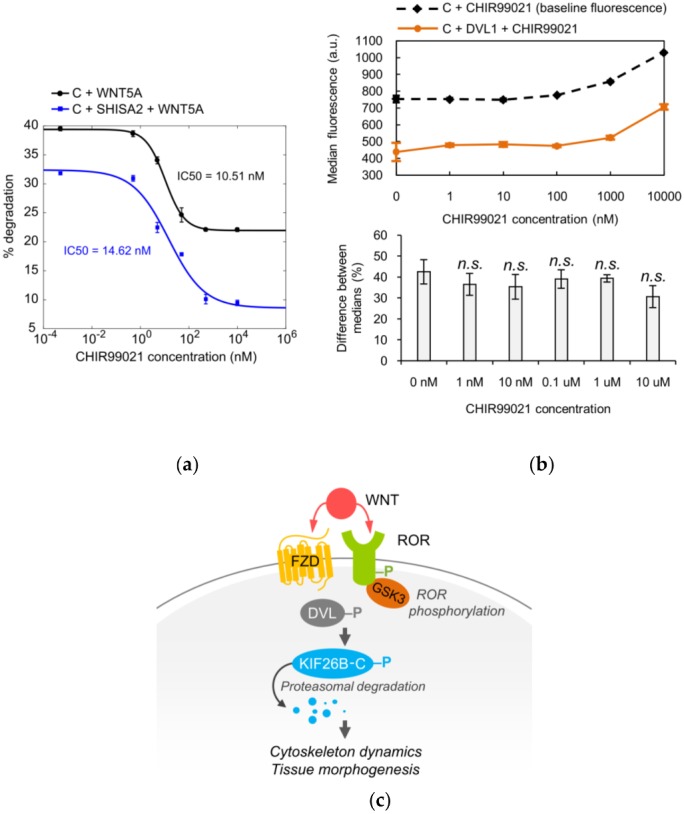
Figure 4.

Glycogen synthase kinase 3 (GSK3) is part of the WNT5A signaling cascade that controls KIF26B-C degradation. (a) Dose-response curves showing WNT5A-induced GFP-KIF26B-C (C) degradation as a function of CHIR99021 (GSK3 inhibitor) concentration, without or with SHISA2 expression in the reporter cells. Error bars represent ± SEM calculated from independent replicates (n = 3 for each experimental condition); (b) Top: Median fluorescence vs. CHIR99021 concentration for GFP-KIF26B-C (baseline fluorescence) and GFP-KIF26B-C fluorescence resulting from DVL1-induced degradation (a.u. = arbitrary units). Bottom: quantification of the percent difference between DVL1-induced fluorescence and baseline medians for each concentration. Error bars represent ± SEM calculated from independent replicates (n = 6 for each experimental condition). For the quantification, statistical analysis was performed with unpaired t-test (n.s. = not significant vs. 0 nM); (c) Model of the role of GSK3 in FZD-ROR receptor dynamics.
