Figure 5.


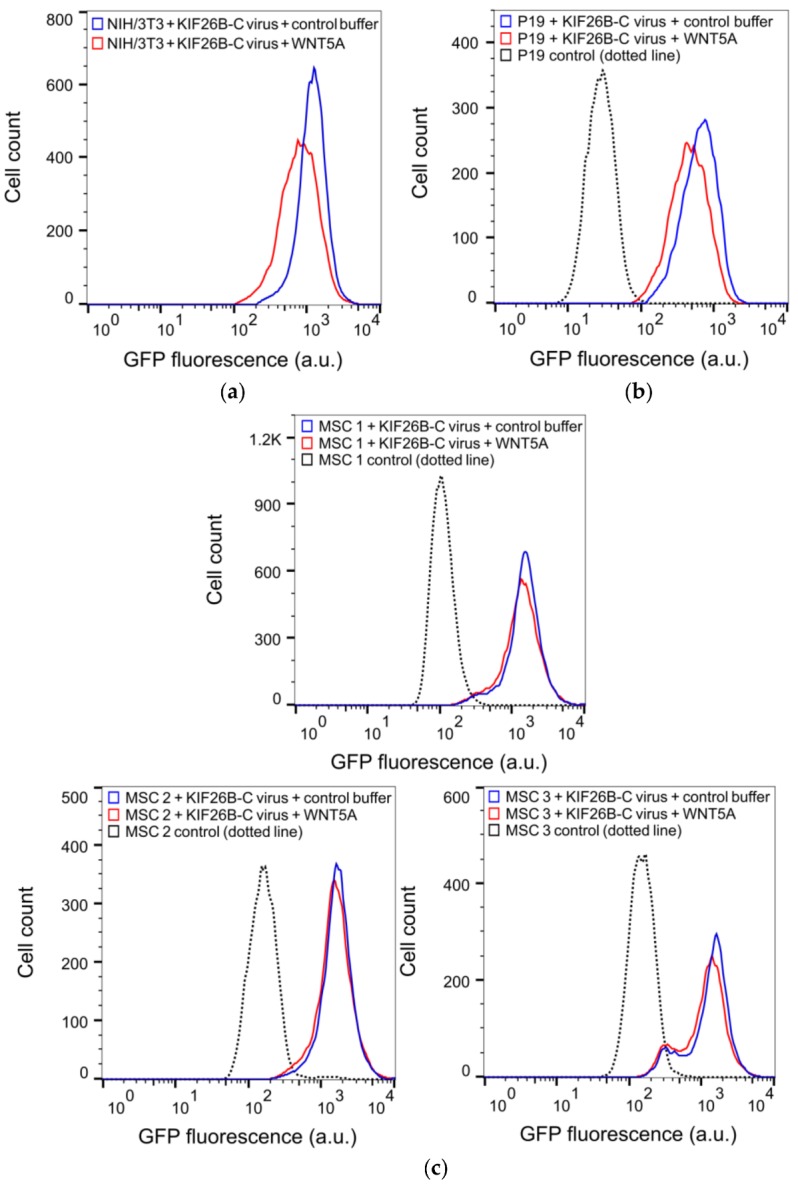
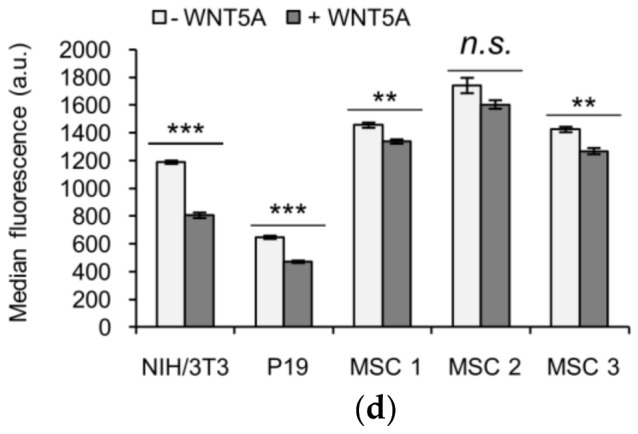
KIF26B-C as a functional reporter for profiling WNT5A signaling activity in somatic and stem cell lines. (a) Flow cytometry histograms depicting the degradation response of the lentiviral GFP-KIF26B-C reporter in NIH/3T3 cells after WNT5A stimulation (a.u. = arbitrary units); (b) Flow cytometry histograms depicting the degradation response of the lentiviral GFP-KIF26B-C reporter in P19 cells after WNT5A stimulation. Dotted trace indicates the autofluorescence of the control, uninfected cells (a.u. = arbitrary units); (c) Flow cytometry histograms depicting the degradation response of the lentiviral GFP-KIF26B-C reporter in three independent lines of primary human MSCs after WNT5A stimulation. Dotted trace indicates the autofluorescence of the control, uninfected cells (a.u. = arbitrary units); (d) Quantification of (a–c) (a.u. = arbitrary units). Error bars represent ± SEM calculated from independent replicates (n = 3 for NIH/3T3, P19; n = 4 for MSC 1, 2 and 3). Statistical analysis was performed with unpaired t-test (n.s. = not significant; *** p value < 0.001; ** p value < 0.01).
