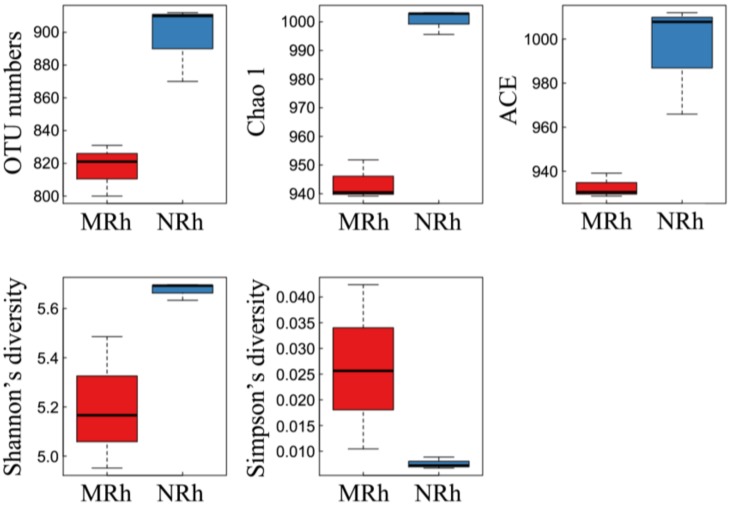
Figure 1.
Boxplot analysis of five indices of alpha diversity. Five lines from top to bottom are the maximum value, the third quartile, median, the first quartile, and the minimum value. MRh represents the rhizospheric soil samples of the control soybean cultivar MD12 (n = 3). NRh represents the rhizospheric soil samples of the glyphosate-tolerant (GT) soybean line N698 (n = 3). OTU: operational taxonomical unit; ACE: abundance coverage-based estimator.

