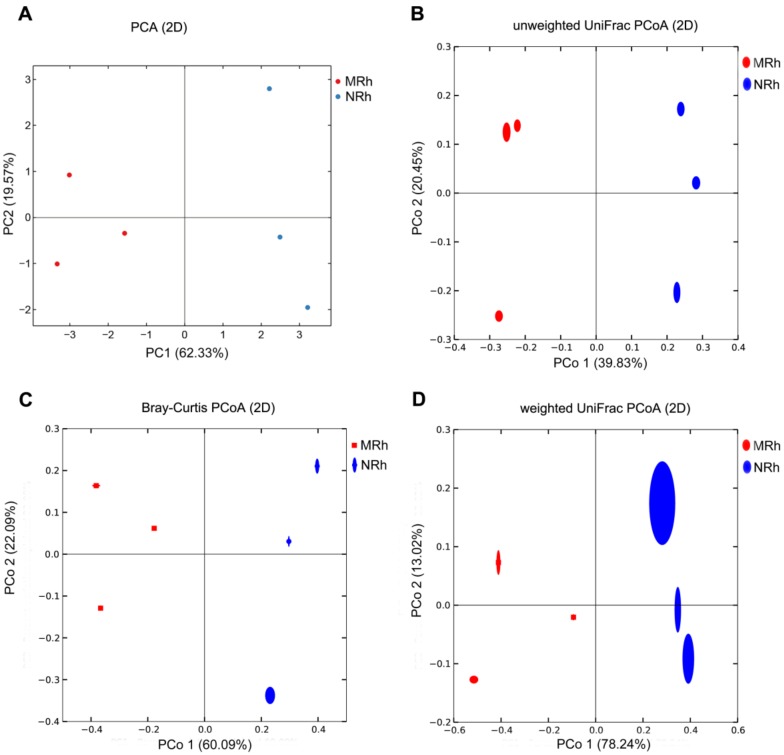
Figure 2.
Beta diversity analysis of the rhizosphere bacterial communities between N698 and MD12 (n = 6). Principal component analysis (PCA) based on OTU abundance of bacterial communities (A); Numbers in brackets represent contributions of principal components to the total variance; The red and light blue dots represent rhizospheric soil replicates of MD12 (MRh) and those of N698 (NRh), respectively. Principal coordinate analysis (PCoA) based on unweighted UniFrac metrics (B), Bray–Curtis metrics (C), and weighted UniFrac metrics (D); the variance explained by each principal coordinate axis is shown in PCo 1 vs. PCo 2; Red ovals or squares represent MD12, and blue ovals represent N698.

