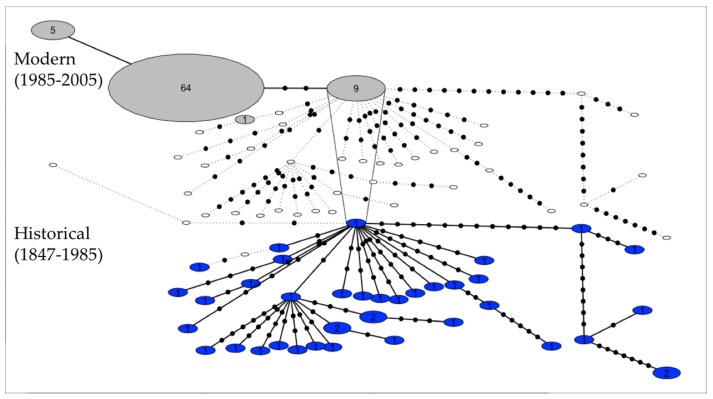
Figure 1.
Temporal haplotype network displaying the change in mitogenome (16,588 bp) diversity through time for historical (in blue, bottom part; n = 39) and modern (in grey, top part; n = 79) kākāpō samples. Circles represent haplotypes and numbers represent sample sizes. Empty circles represent absent haplotypes for a given time period. Haplotypes found in multiple time periods are connected by vertical lines. Within each time period, black dots represent one mutation.

