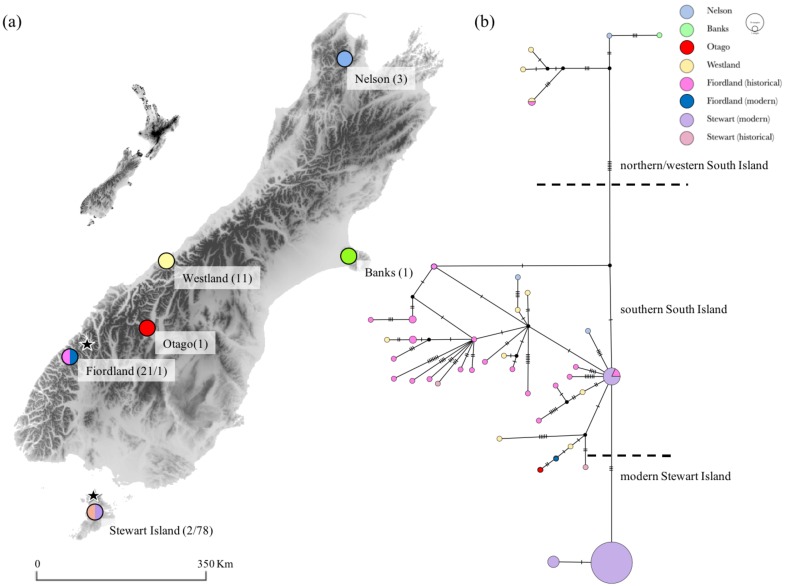
Figure 3.
(a) Sampling locations for 39 historical and 79 modern kākāpō. Full circles represent sampling locations for historical specimens only and split circles refer to sampling locations for both historical specimens and modern birds. Numbers represent sample sizes for each location and dataset. Stars represent geographic origin of the founders. (b) Median-joining haplotype network for 118 kākāpō mitogenomes (16,588 bp). Geographical locations in the legend are listed from north to south.

