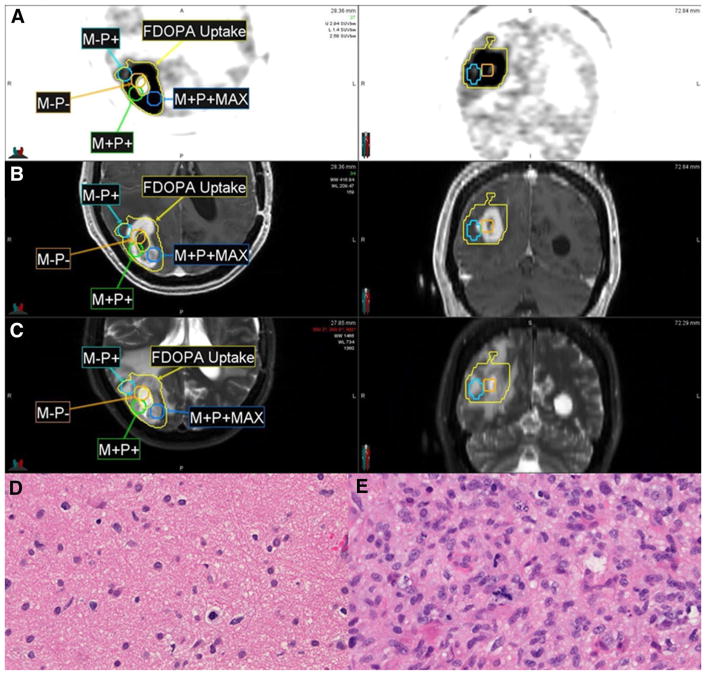
Fig. 1.
Representative 18F-DOPA-PET (a), T1 post-contrast MRI (b), and T2 MRI (c) demonstrating regions of concordant and discordant MRI and PET findings. The regions shown include a 0.5-cm radial expansion upon the stereotactic biopsy coordinate. The M-P+ biopsy specimen (SUVmax 2.73; d) showed lower cellularity compared with the M+P+MAX specimen (SUVmax 4.66; e). M-P−: non-enhancing, PET-negative; M-P+: non-enhancing, PET-positive; M+P+: enhancing, PET-positive

