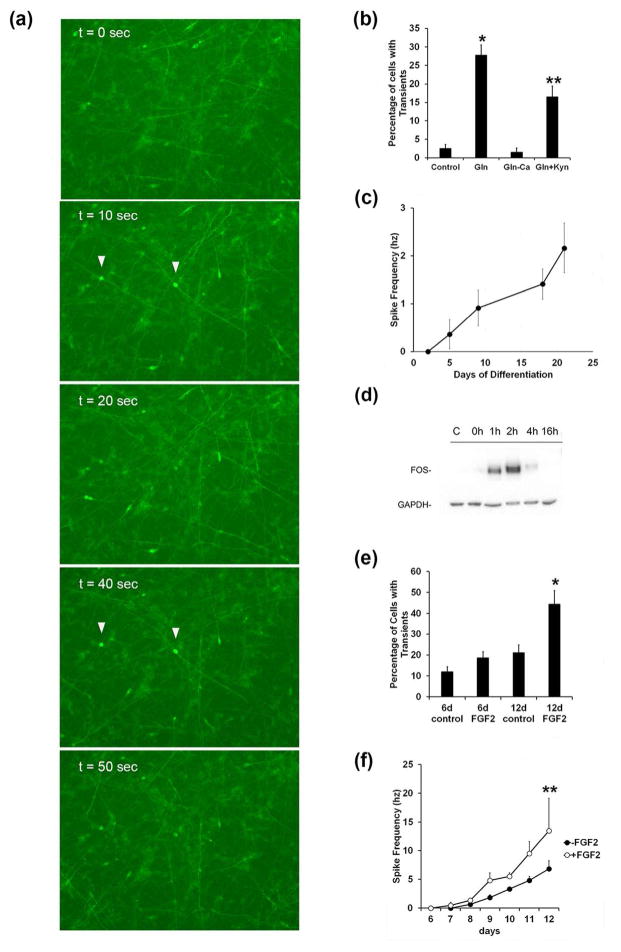
Figure 5. Calcium imaging of stable inducible neurons and the effect of FGF2.
(a). GCamp6f fluorescent images of siNeurons at day 12 in EM buffer with 2.5 mM Gln showing fluorescence at the times indicated. Arrows indicate two neurons that show intermittent simultaneous spiking of calcium fluorescence. (b) Quantitation of the fraction of siNeurons at day 12 showing spontaneous calcium transients over a 20 min recording period in control EM media, EM media containing 2.5 mM Gln, EM media containing 2.5 mM Gln but lacking calcium, and EM media containing 2.5 mM Gln (*) and 2 mM kynurenic acid (**). Data representative of three independent experiments (n=3). (c) MEA measurements of spontaneous spike frequency in siNeurons as a function of differentiation time. (d) Induction of FOS protein at various times following calcium imaging experiments in EM buffer containing 2.5 mM Gln. Control indicates siNeurons incubated for 2h in EM buffer without Gln. (e) Effect of FGF2 treatment on spontaneous calcium activity of neurons incubated with or without 2 ng/ml FGF2 for 6 days and imaged at day 6 or treated for days 7–12 and imaged at day 12 (*). Statistical significance using Student’s t-test is shown as *, p<0.05; **, p<0.01.

