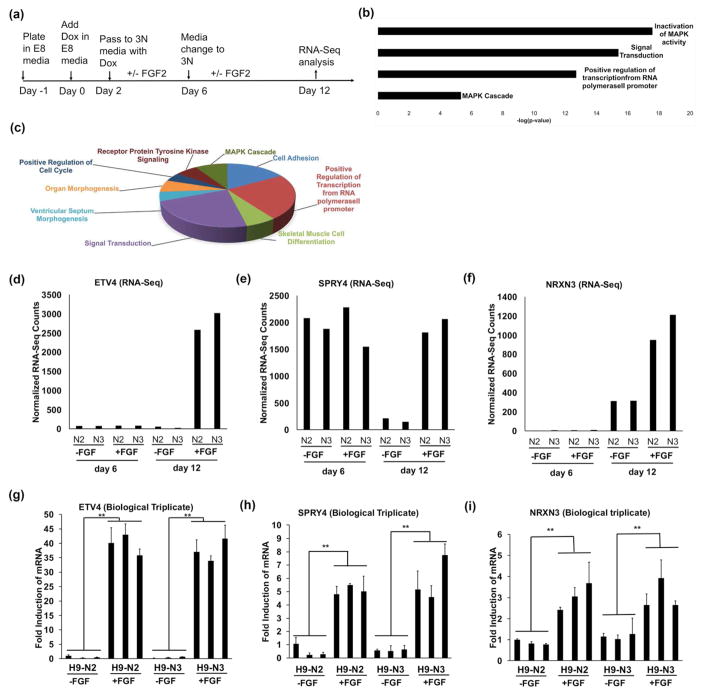
Figure 6. Global transcription effects of FGF2 on siNeurons.
(a) Experimental design to study the transcriptional gene changes upon treatment of siNeurons with 20 ng/ml FGF2 for different durations over 12 days during or after Dox treatment. (b) Gene Ontology terms attributed to highly induced gene transcripts (fold change >5) in the presence of FGF2. (c) Pie-chart showing the GO biological process term distribution among the 834 differentially expressed genes. (d–f) Normalized gene expression levels reported by RNA-Seq for the induced genes, PEA3 (ETV4), SPRY4, and NRXN3 in two independent cell lines at day 6 and day 12 respectively. No significant difference was seen at day 6 but the expression level increased (ETV4, NRXN3) or decreased (SPRY4) significantly in presence of FGF2 at day 12. (g–i) Quantification of mRNA levels for the genes PEA3 (ETV4), SPRY4, and NRXN3 in biological triplicates of two independent cell lines showing a significant increase in expression in the presence of FGF2; **, p<0.01.

