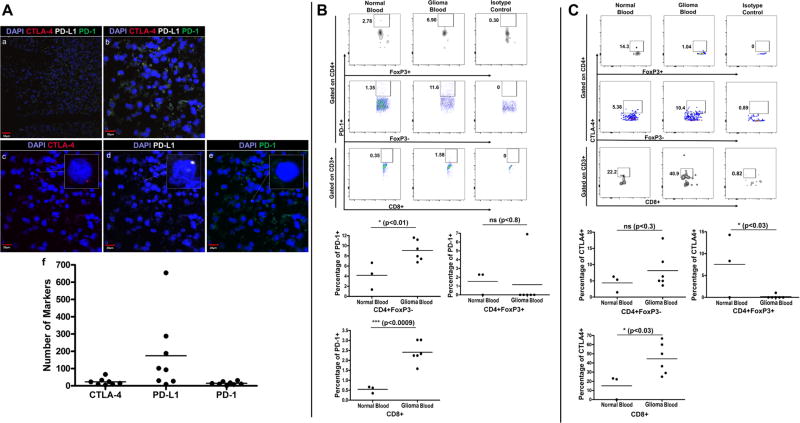
Figure 3. Immune Checkpoint Markers on Tumor-Infiltrating and Circulating Immune Cells.
A) RNA in situ hybridization of tumor samples stained with DAPI and three RNA probe conjugated markers, cyanine 3 [CTLA-4], cyanine 5 [PD-L1] and fluorescein [PD-1]. (a) Staining for CTLA-4, PD-L1, and PD-1 shown at 20× magnification. Scale bar, 50 µm. (b) Staining for CTLA-4, PD-L1, and PD-1 shown at 60× magnification. Scale bar, 20 µm. (c) Staining for CTLA-4 at 60×. Scale bar, 20 µm. (d) Staining for PD-L1 at 60×. Scale bar, 20 µm. (e) Staining for PD-1 at 60×. Scale bar, 20 µm. (f) Scatter plot showing number of CTLA-4, PD-L1 and PD-1 markers counted on slide samples at 60× magnification. (n = 8) B) Gating strategy for analyzing PD-1 expression on CD4+, CD8+ and CD4+FoxP3+ T cells in peripheral blood of normal dogs (n = 3) vs. dogs with glioma (n = 6) and scatter plots representing the percentage of T-cells expressing PD-1. C) Gating strategy for analyzing CTLA-4 expression on CD4+, CD8+ and CD4+FoxP3+ T cells in peripheral blood of normal (n = 3) and glioma-bearing dogs (n = 6) and scatter plots representing the percentage of T-cells expressing CTLA-4.

