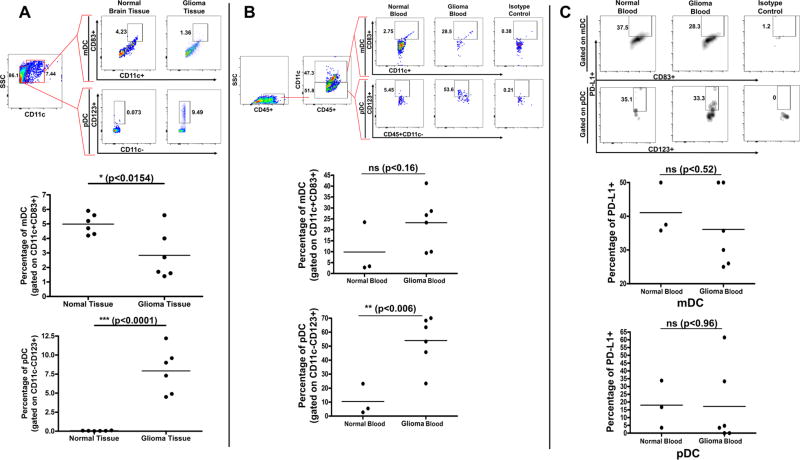
Figure 4. pDC and mDC Populations in Brain Tissue and Peripheral Blood of Normal and Glioma-Bearing Canine Patients.
A) Gating strategy for analyzing pDCs and mDCs from normal brain tissue (n = 6) and canine glioma (n = 6). Scatter plots representing the percentage of pDCs and mDCs B) Gating strategy for analyzing pDCs and mDCs in the peripheral blood of normal (n = 3) and glioma-bearing dogs (n = 6). Scatter plots representing the percentage of pDCs and mDCs C) Gating strategy for analyzing PD-L1 expression on pDCs and mDCs in peripheral blood of normal dogs (n = 3) vs. dogs with glioma (n = 6) and scatter plots representing the percentage of DCs expressing PD-L1.

